Vote Histogram
The Vote Histogram app contains the widget Issue Votes Histogram to help visualize how many times and when users voted for an issue.
After installing the app and activating the widget on selected projects, the Issue Votes Histogram option is added to the
Show more menu in single issues. If the issue has votes, select this option for a visual representation of the vote distribution over time.

To add an Issue Votes Histogram widget to a project:
From the main navigation menu, select
.
Select the Vote Histogram app in the list of apps.
The details section for the app opens.
Select the Projects tab.
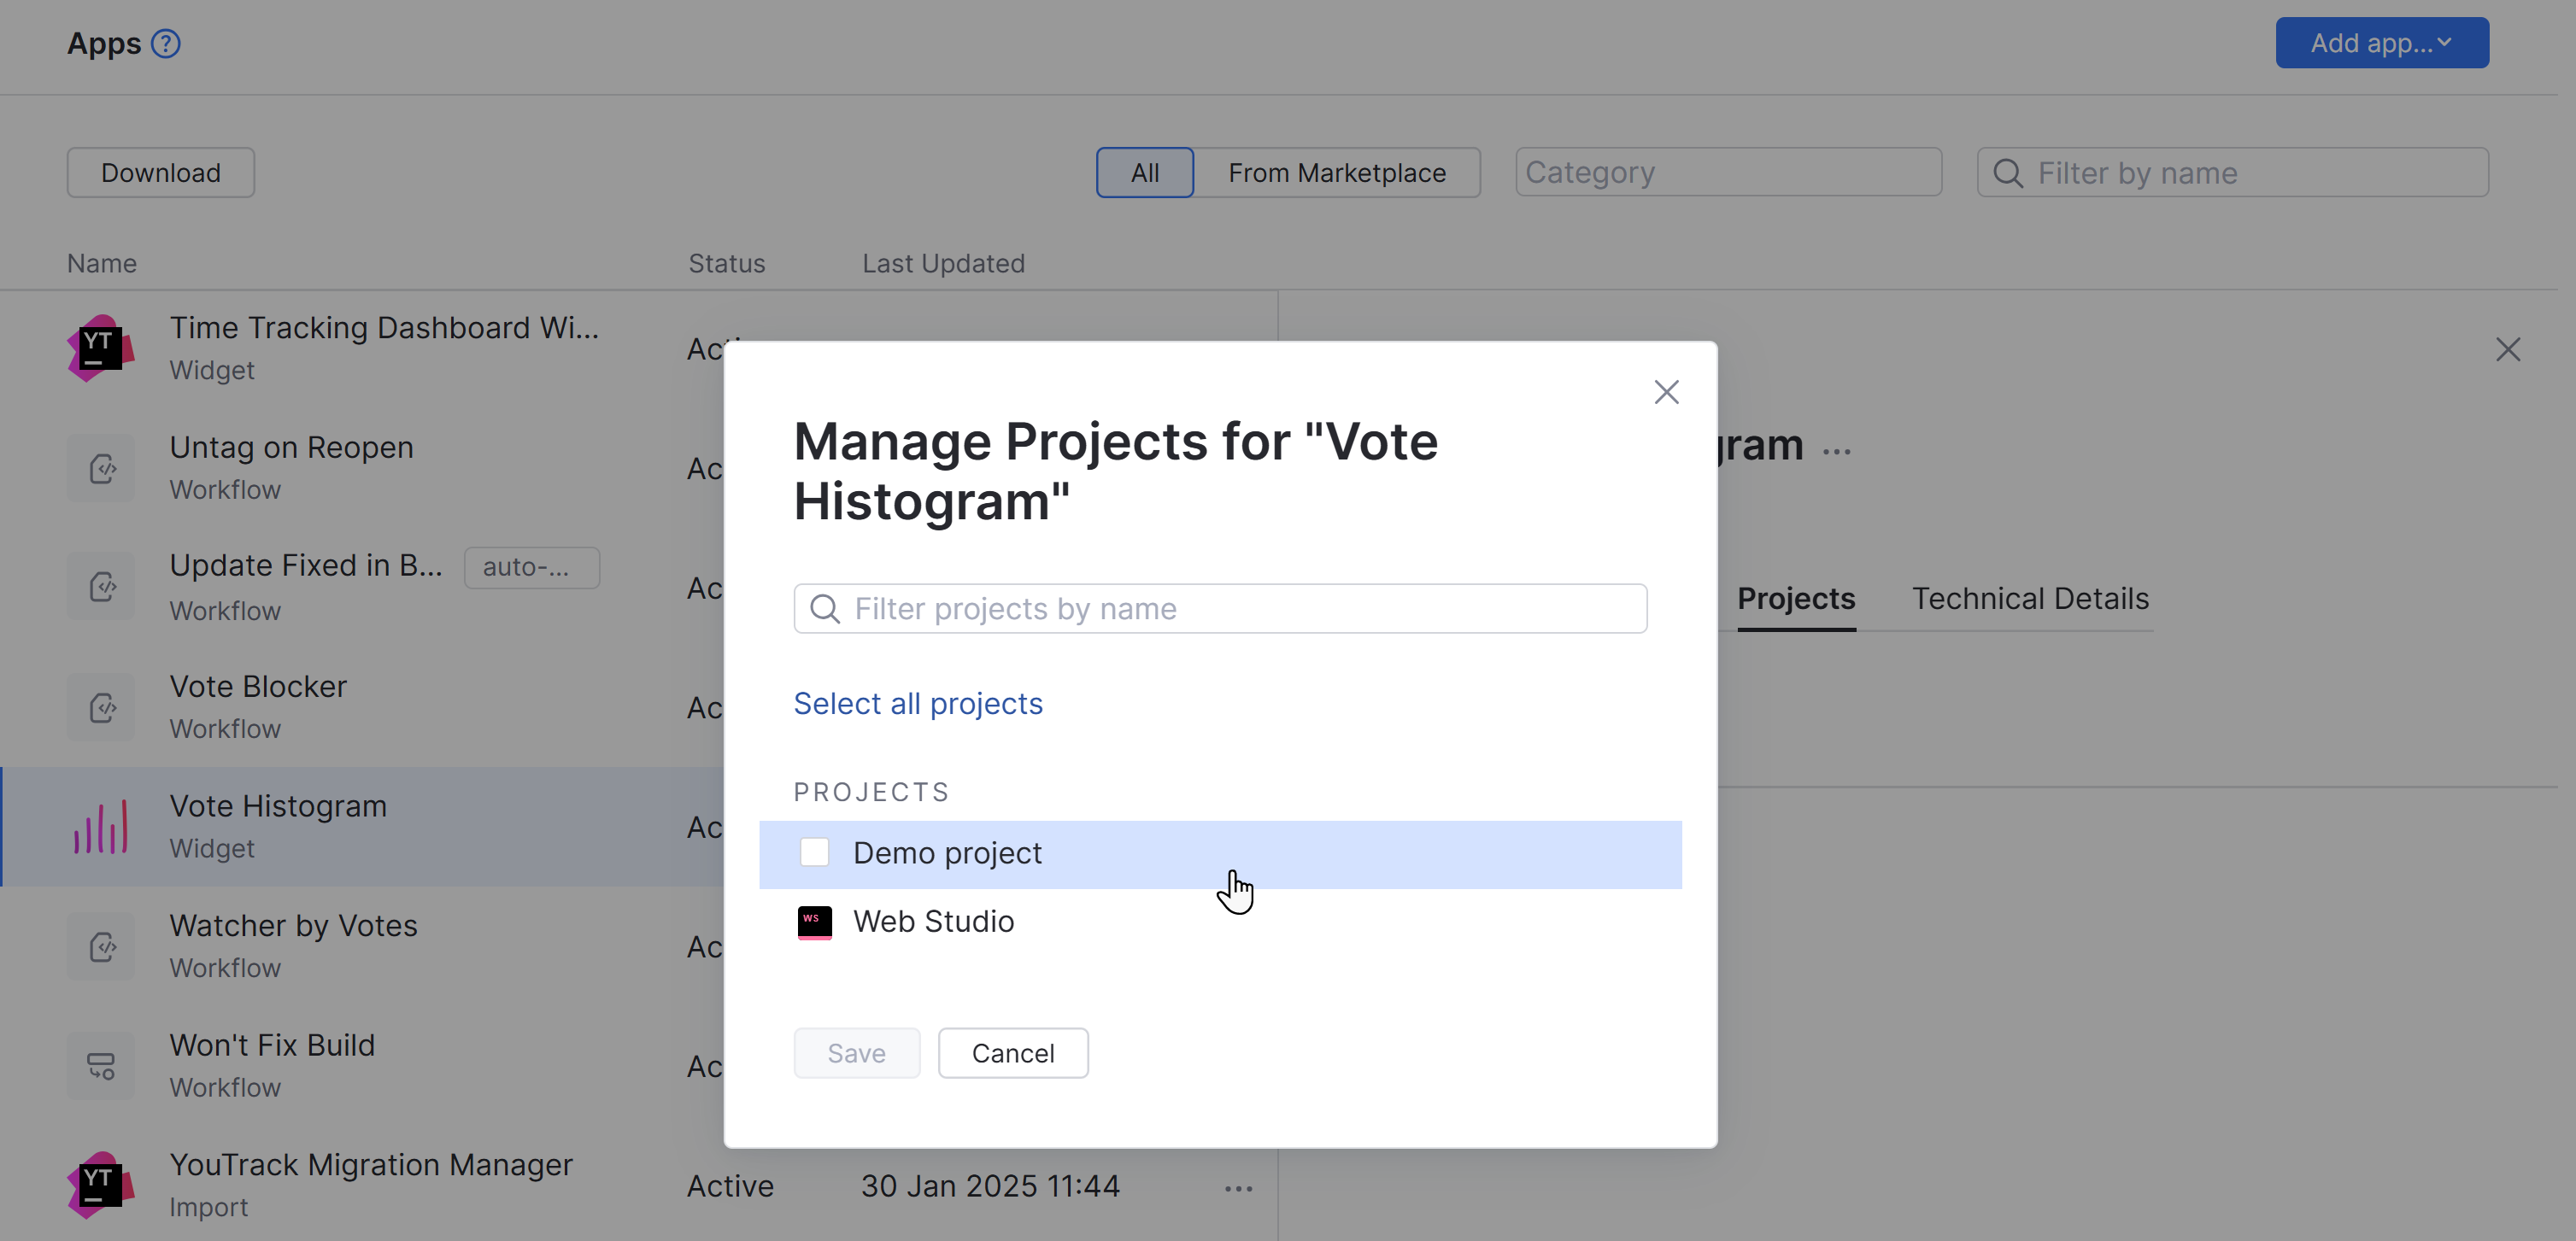
Click the Manage projects button.
A dialog opens displaying projects available for the widget.
If a project is colored gray, the user doesn't have permission to activate the widget for the project.
Select projects to activate or deactivate the Issue Votes Histogram widget.

Click Save to confirm projects that have the feature to visually display issue votes as a histogram.
Working with the Issue Votes Histogram Widget
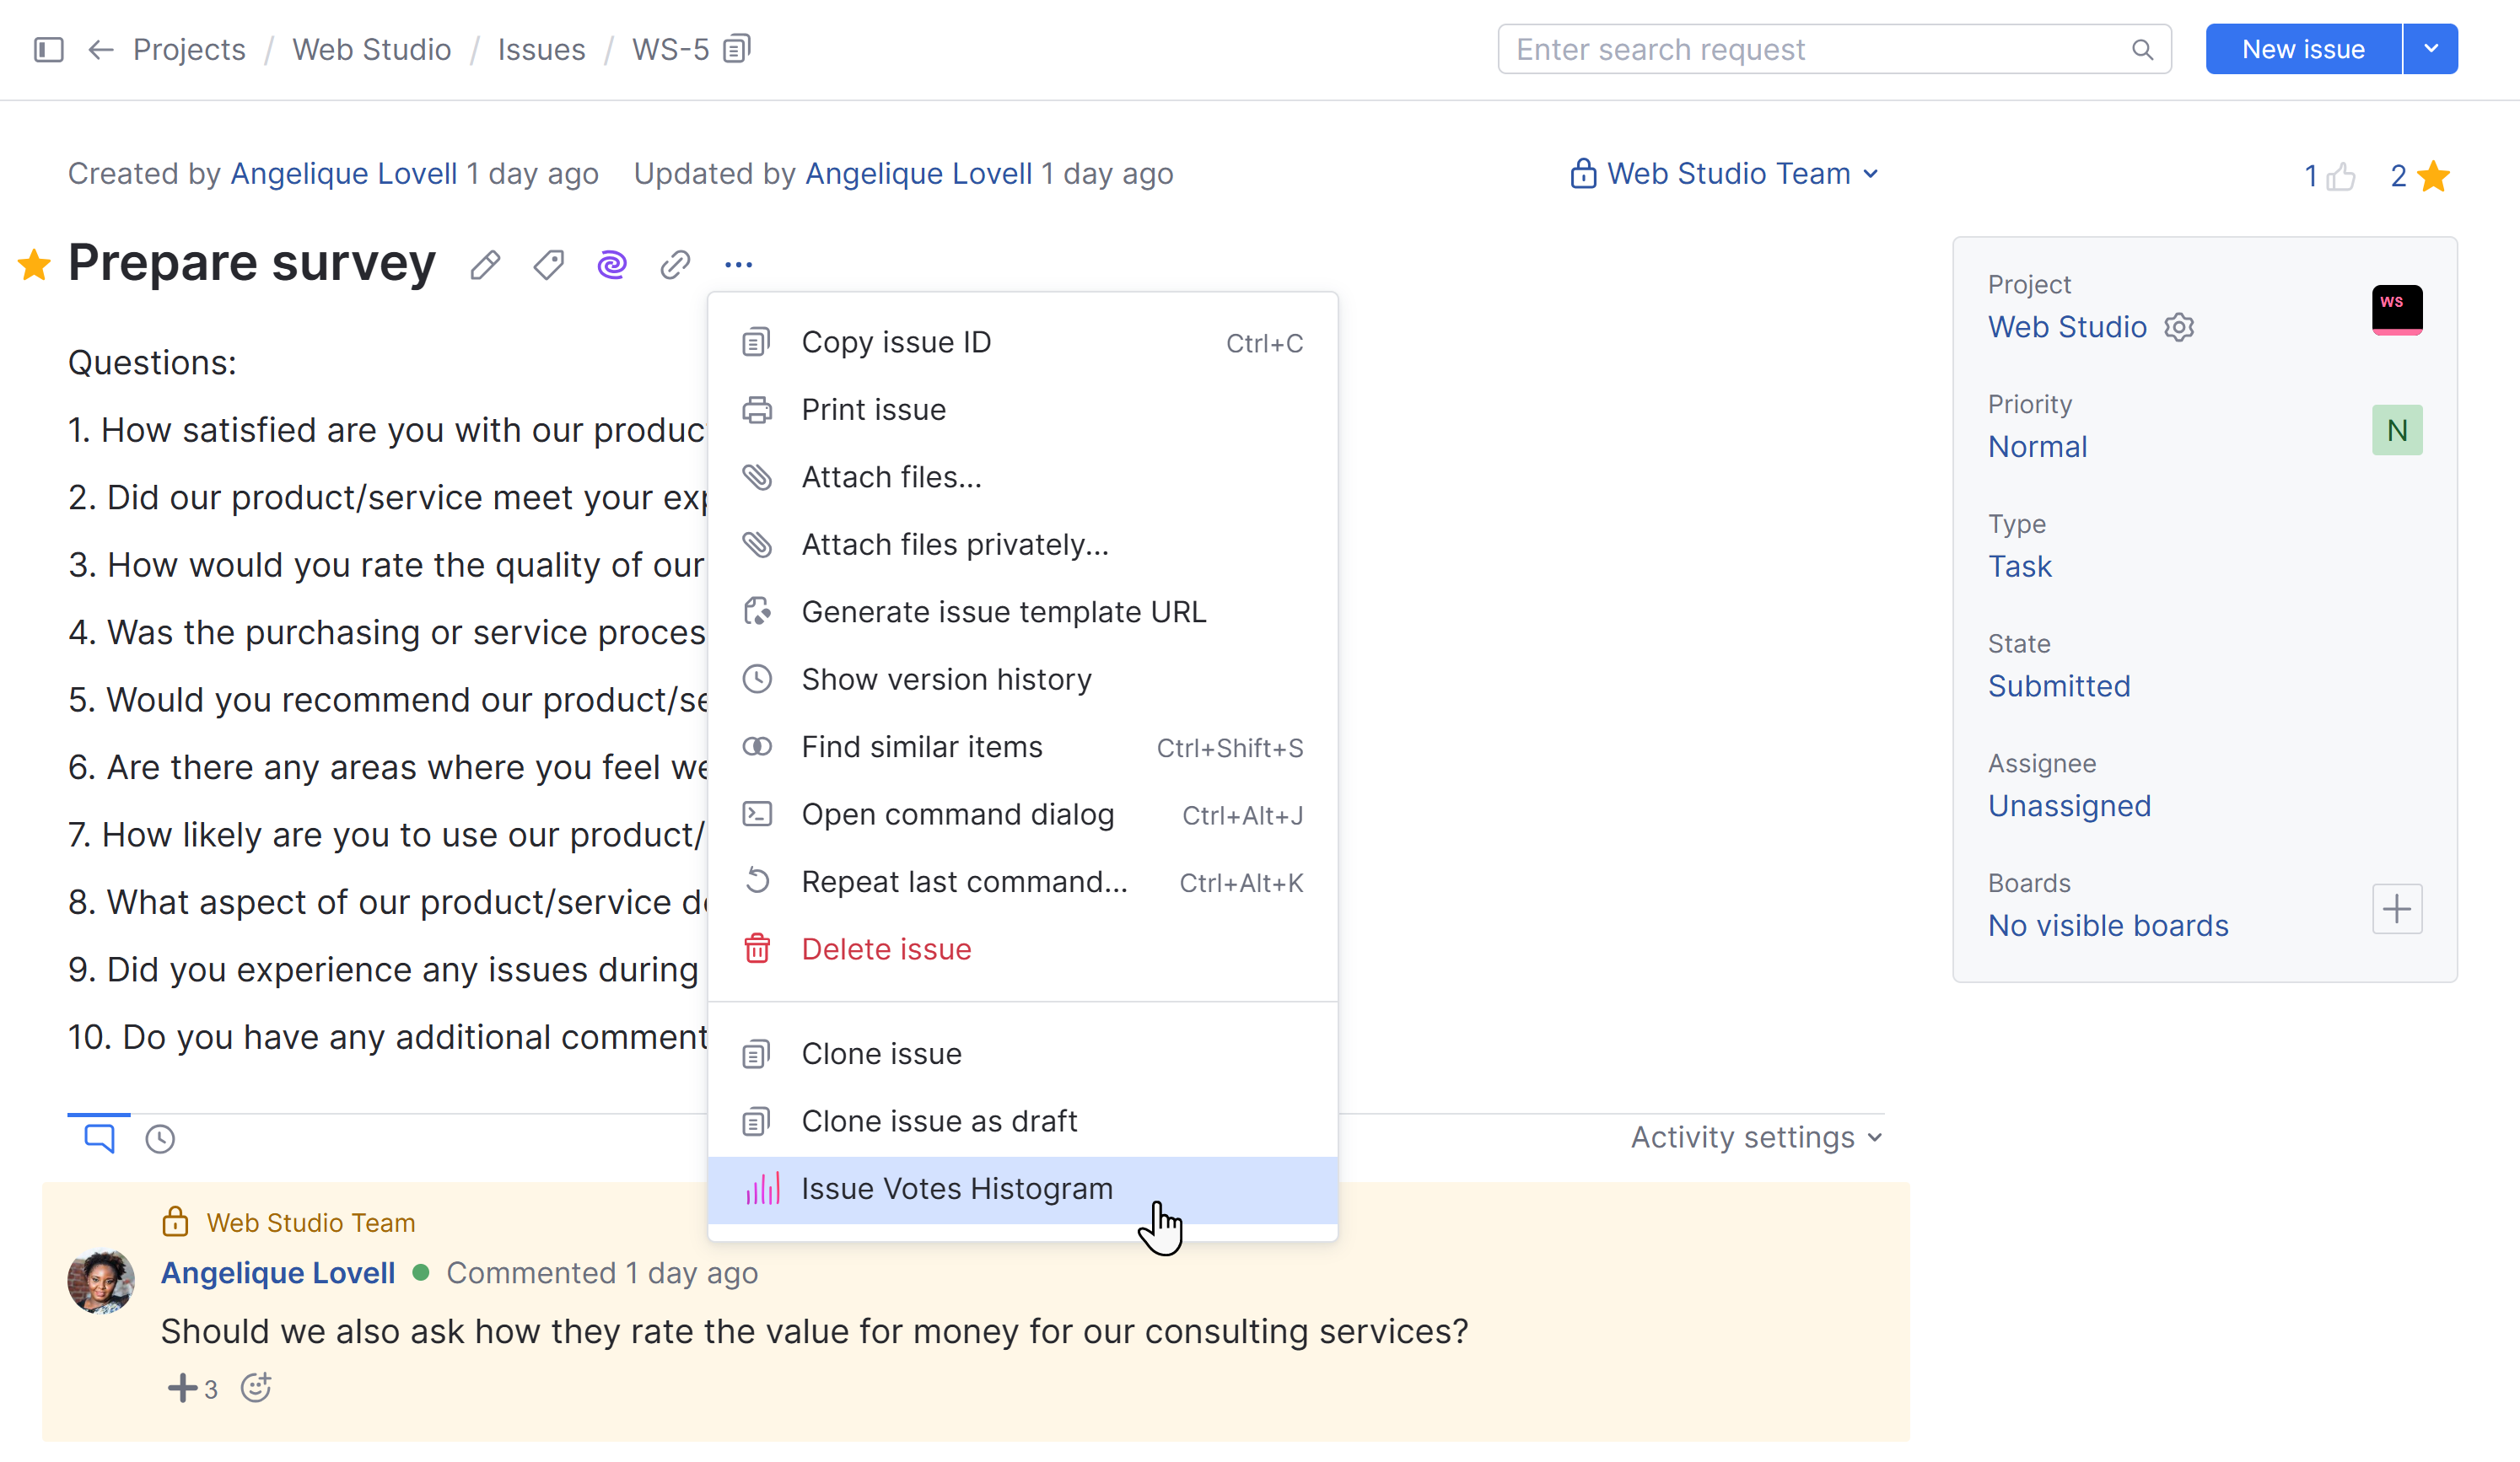
The Issue Votes Histogram widget works directly in your project issues. Open the Show more menu in an issue and select
Issue Votes Histogram to open the graph.
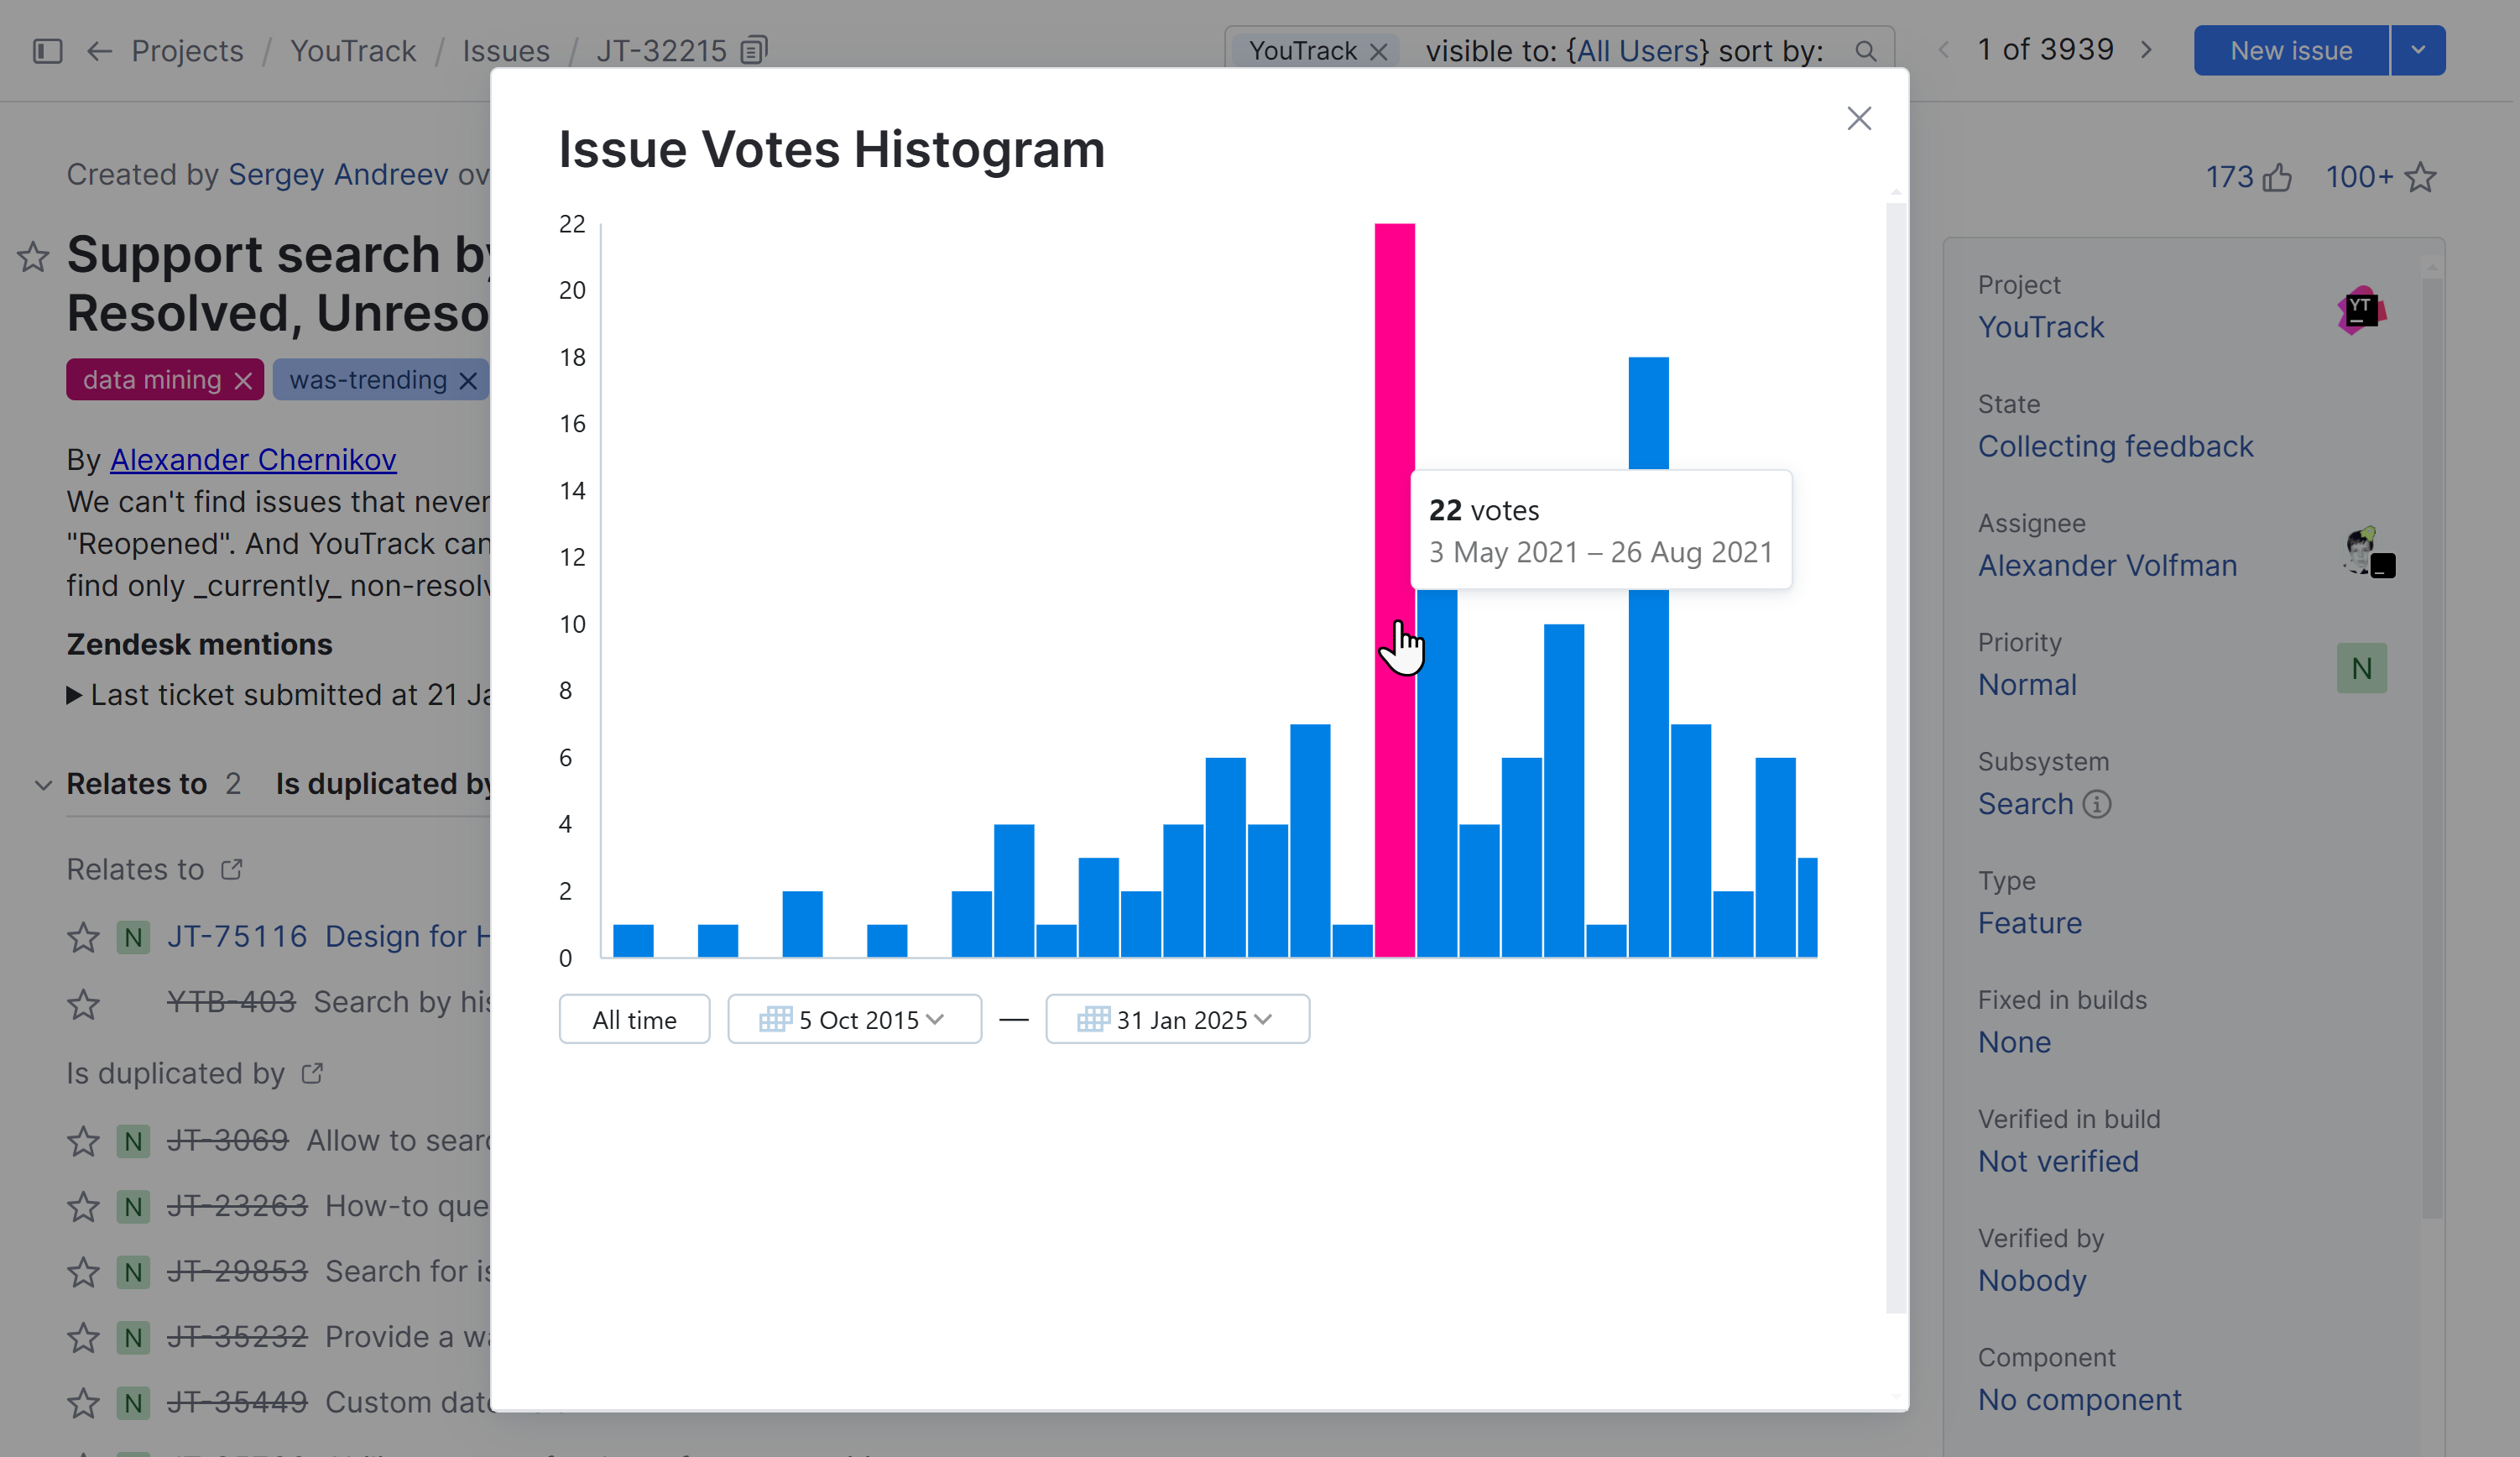
A histogram graph displays an x-axis representing the time period of the graphic and a y-axis representing the number of votes for the issue.
The x-axis time period values can be adjusted. Click the left time period button to adjust the start date. Click the right time period button to adjust the end date. Click All time to reset the chart showing a time period that covers every issue vote.
Placing your cursor over a column on the histogram displays the number of votes and the time period for the column.

To view the Issue Votes Histogram for an issue:
From the main navigation menu, select
Issues.
Open an issue in Single Issue View.
Open the
Show more menu and select
Issue Votes Histogram to open the chart.

Click the
icon to close the histogram and return to the issue.