Resolved vs New/Reopened Rate
The report shows you the rate of incoming and outgoing issues in one or more projects. It displays the ratio between the issues that were resolved and the number of issues that were created or reopened within a specified time frame.
This report is similar to the Fixed vs Reported Rate report, with the following differences:
Any state that is assigned the Resolved property is considered, not just the Fixed state.
Issues that are reopened are included in the calculation of outstanding issues, not just reported issues.
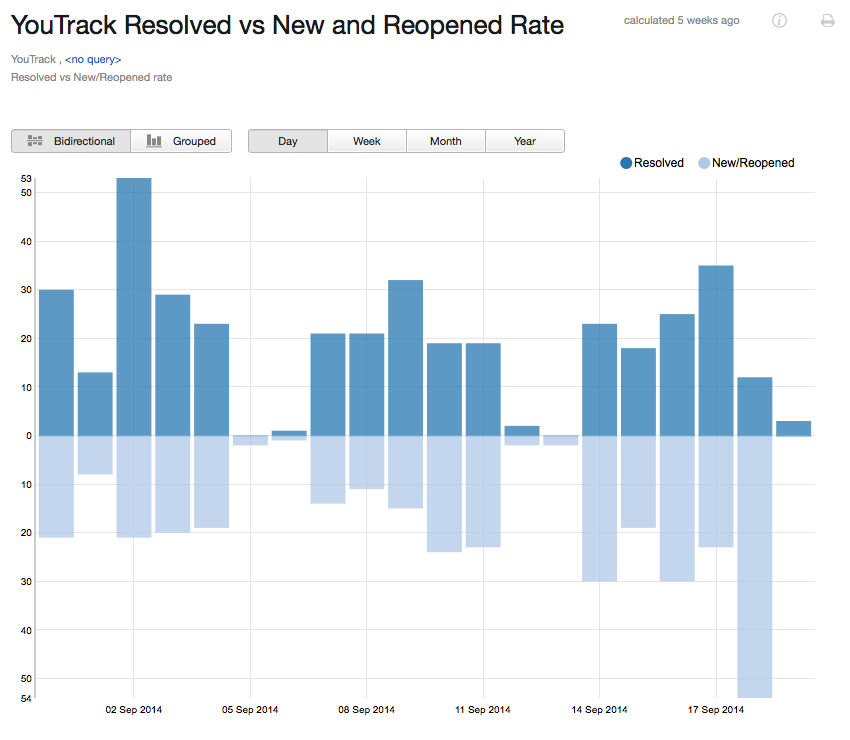
When the report is calculated, you can toggle the presentation to show a bidirectional or grouped bar chart. The following options are available in a calculated report:
Move the pointer over a bar to display the total number of issues that were resolved and created or reopened for the period that is represented by the bar. The time frame represented by the bar is also shown.
Select a period to show the total number of issues that were resolved and created or reopened on a daily, weekly, monthly, or yearly basis.
Select a label in the legend to show or hide the corresponding values in the report.
Prerequisites
To use this report, configure each project that you include in the report according to the following guidelines:
Use the default State custom field to identify the current status of each issue.
Enable the Resolved property for all the values for this field that you use for resolved issues.
Create a Resolved vs New/Reopened Rate Report
To create a resolved vs new/reopened rate report:
From the main navigation menu, select
Reports.
Click the New report button.
Click the link for the Resolved vs New/Reopened rate report.
In the settings page for the report, set the parameters for the new report.
To learn more about the settings for this report, refer to the settings.
When you are finished with the report settings, click the Create report button.
The report is sent to the processing queue of your YouTrack server.
When processing is finished, the new report is displayed.
Settings
Use the following settings to configure this report.
Setting | Description |
|---|---|
Report name | The name of the report. |
Projects | The projects for which the report is calculated. The projects that are visible in the list are displayed based on your Read Project Basic access permissions. |
Issue filter | The Query and Projects settings let you narrow the scope of your report to receive more precise results. The search query field supports the same syntax and auto-completion that are available in the search box. |
Period | The time frame for which issues are displayed in the report. |
Automatically Recalculate | Configures periodic recalculation for your report.
|
Can view and use | Sets the visibility for the report. By default, the report is visible to its owner only. To share the report with other users, select a group or project team from the list. |
Can edit | Determines who has permission to view and edit the report settings. To let other users update the report settings, select a group or project team from the list. |
Example
A report with the following settings displays issues that were resolved and reported or reopened in the YouTrack project for the previous month. The calculated report is displayed as a bidirectional bar chart. The values are shown for each day of the month.
Setting | Value |
|---|---|
Projects | YouTrack |
Period | Last month |

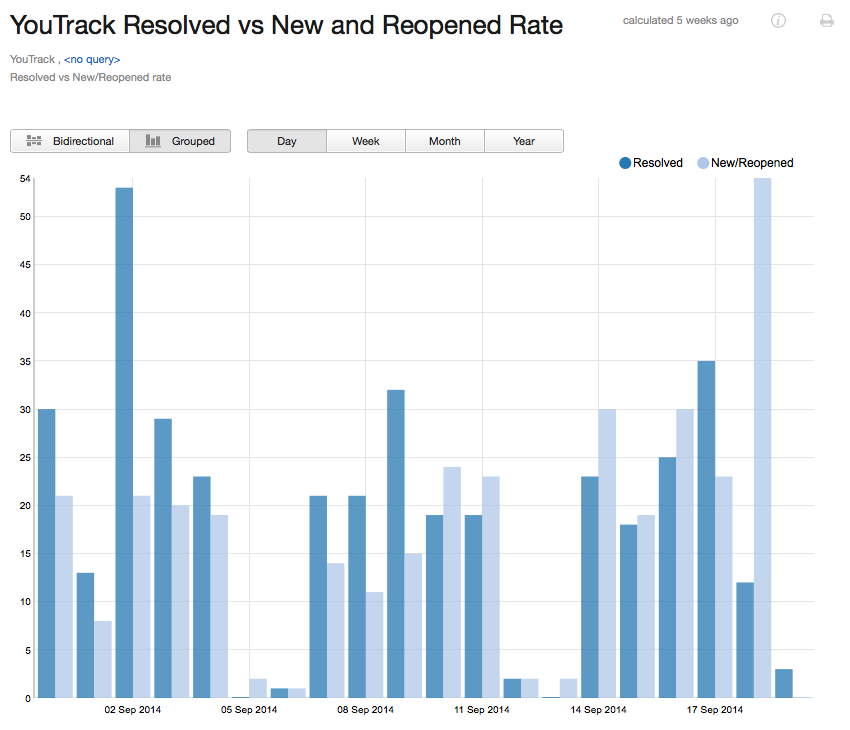
Here is the same report displayed as a grouped bar chart:

View a Resolved vs New/Reopened Rate Report
All reports that you have permission to view are available in a drop-down list in the header of Reports.
To view a Resolved vs New/Reopened rate report:
From the main navigation menu, select
Reports.
Open the drop-down list of reports in the header and select a report.
Reports can also be displayed on YouTrack dashboards with the use of a widget.
For more information, see Reports Widgets.