Verified vs Reopened Rate
The report compares the number of issues that were verified in one or more projects to the number of issues that were reopened within a specified time frame. The report is pre-configured to use the value stored in the State field to determine whether the issue was verified or reopened. Use this report to measure the number of issues that pass or fail quality assurance tests.
warning
The report tracks the total number of transitions reported for issues that match the issue filter. In situations where a single issue is verified, then reopened and verified again within the specified time, the verification is reported twice.
When the report is calculated, you can toggle the presentation to show a bidirectional or grouped bar chart. The following options are available in a calculated report:
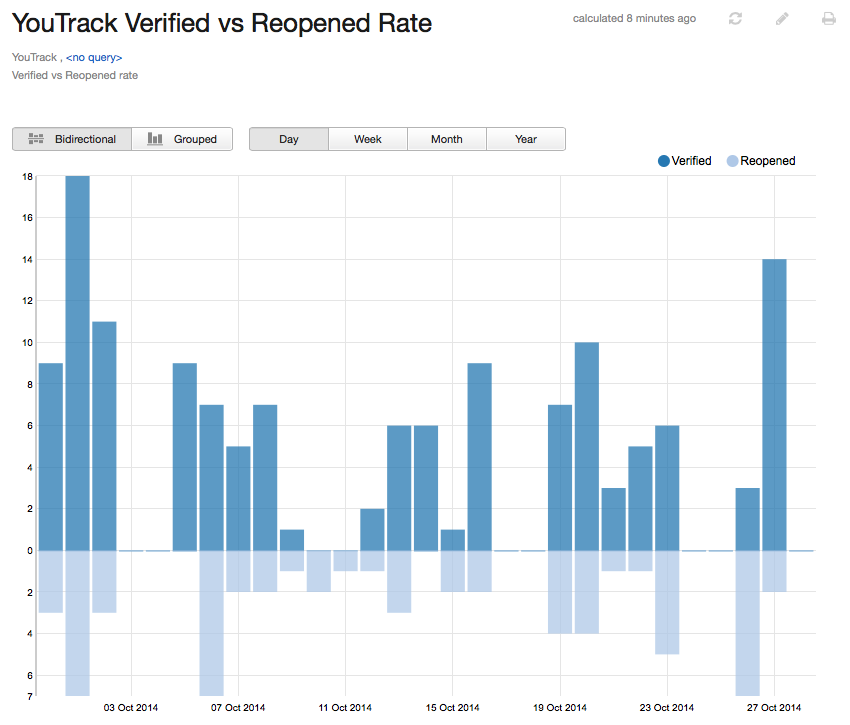
Move the pointer over a bar to display the total number of issues that were verified and reopened for the period that is represented by the bar. The time frame represented by the bar is also shown.
Select a period to show the total number of issues that were verified and reopened on a daily, weekly, monthly, or yearly basis.
Select a label in the legend to show or hide the corresponding values in the report.
To use this report, configure each project that you include in the report according to the following guidelines:
Use the default State custom field to identify the current status of each issue.
Assign the value Verified in this field to issues that have been verified.
To count the number of verified issues, the algorithm for this report searches for values in the State field that include the substring verif. This means that you can include additional states that are considered as verified in the calculation of this report. For example, the YouTrack development team uses the state Without verification to mark issues that cannot be verified in the application. These issues are also included in the total number of verified issues in the report.
tip
Requires permissions: Create Report
Click Reports in the main navigation menu.
Click the New report button.
Click the link for the Verified vs Reopened rate report.
In the settings page for the report, set the parameters for the new report.
To learn more about the settings for this report, refer to the settings.
When you are finished with the report settings, click the Create report button.
The report is sent to the processing queue of your YouTrack server.
When processing is finished, the new report is displayed.
Use the following settings to configure this report.
Setting | Description |
|---|---|
Report name | The name of the report. |
Projects | The projects for which the report is calculated. The projects that are visible in the list are displayed based on your Read Project Basic access permissions. |
Issue filter | The Issue filter and Projects settings let you narrow the scope of your report to receive more precise results. The search query field supports the same syntax and auto-completion that are available in the search box. |
Period | The time frame for which issues are displayed in the report. |
Automatically Recalculate | Configures periodic recalculation for your report.
|
Can view and use | Sets the visibility for the report. By default, the report is visible to its owner only. To share the report with other users, select a group or project team from the list. |
Can edit | Determines who has permission to view and edit the report settings. To let other users update the report settings, select a group or project team from the list. |
A report with the following settings displays issues that were verified and reopened in the YouTrack project for the previous month. The calculated report is displayed as a bidirectional bar chart. The values are shown for each day of the month.
Setting | Value |
|---|---|
Projects | YouTrack |
Period | Last month |

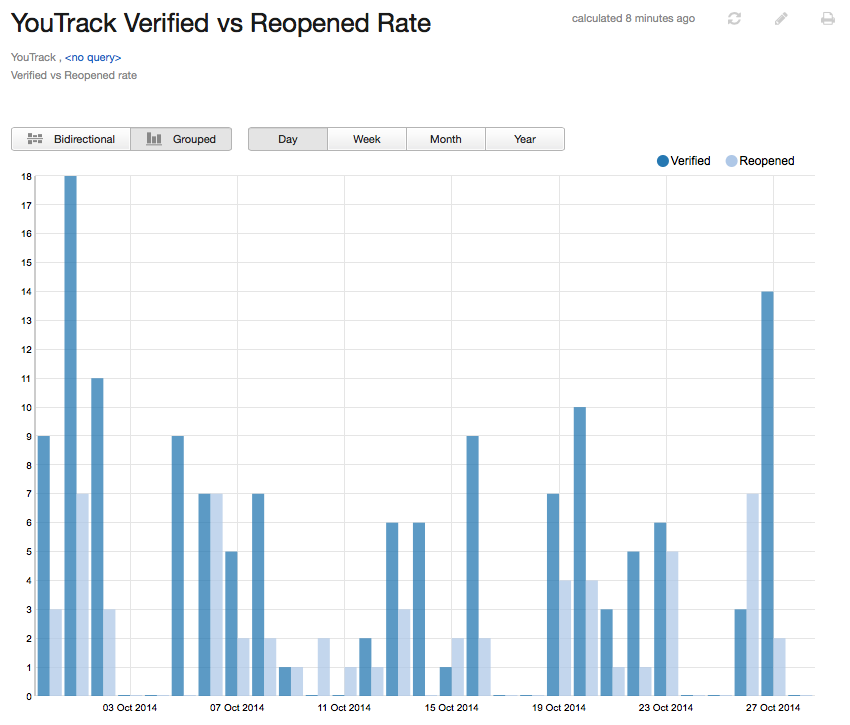
Here is the same report displayed as a grouped bar chart:

All reports that you have permission to view are available in a drop-down list in the header of Reports.
Click Reports in the main navigation menu.
Open the drop-down list of reports in the header and select a report.
Reports can also be displayed on YouTrack dashboards with the use of a widget.
For more information, see Reports Widgets.