Debug Python extensions
Cross-debugging for mixed Python and C/C++ code is not currently supported in CLion (CPP-5797). However, you can use one of the options described below to workaround this when working with Python extension modules.
In order to debug the C/C++ code of an extension, you need to use the native debugger, GDB or LLDB, and debug the interpreter process that loads your script and runs the application. For that, you can either attach to a running Python process or debug a properly configured Custom Build Application.
Option 1: Attach to a running Python process with the native debugger
Set breakpoints and make sure they are going to be hit after you attach to the process.
Launch the Python script. You can do that from your system terminal, CLion's built-in terminal, or by running a Python configuration.
Call Run | Attach to Process from the main menu or press Ctrl+Alt+F5.
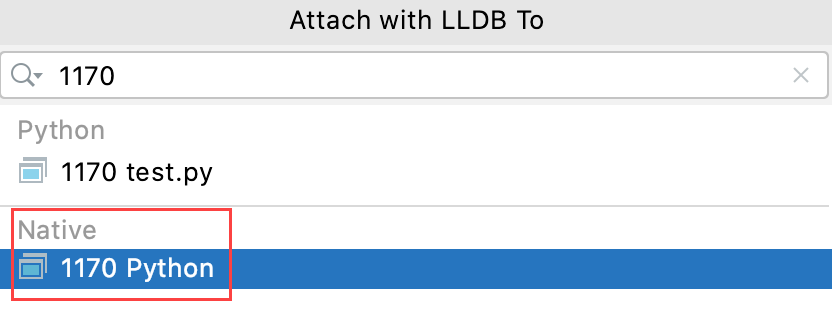
In the list of entries, search for the one that corresponds to the process's PID under the Native node:

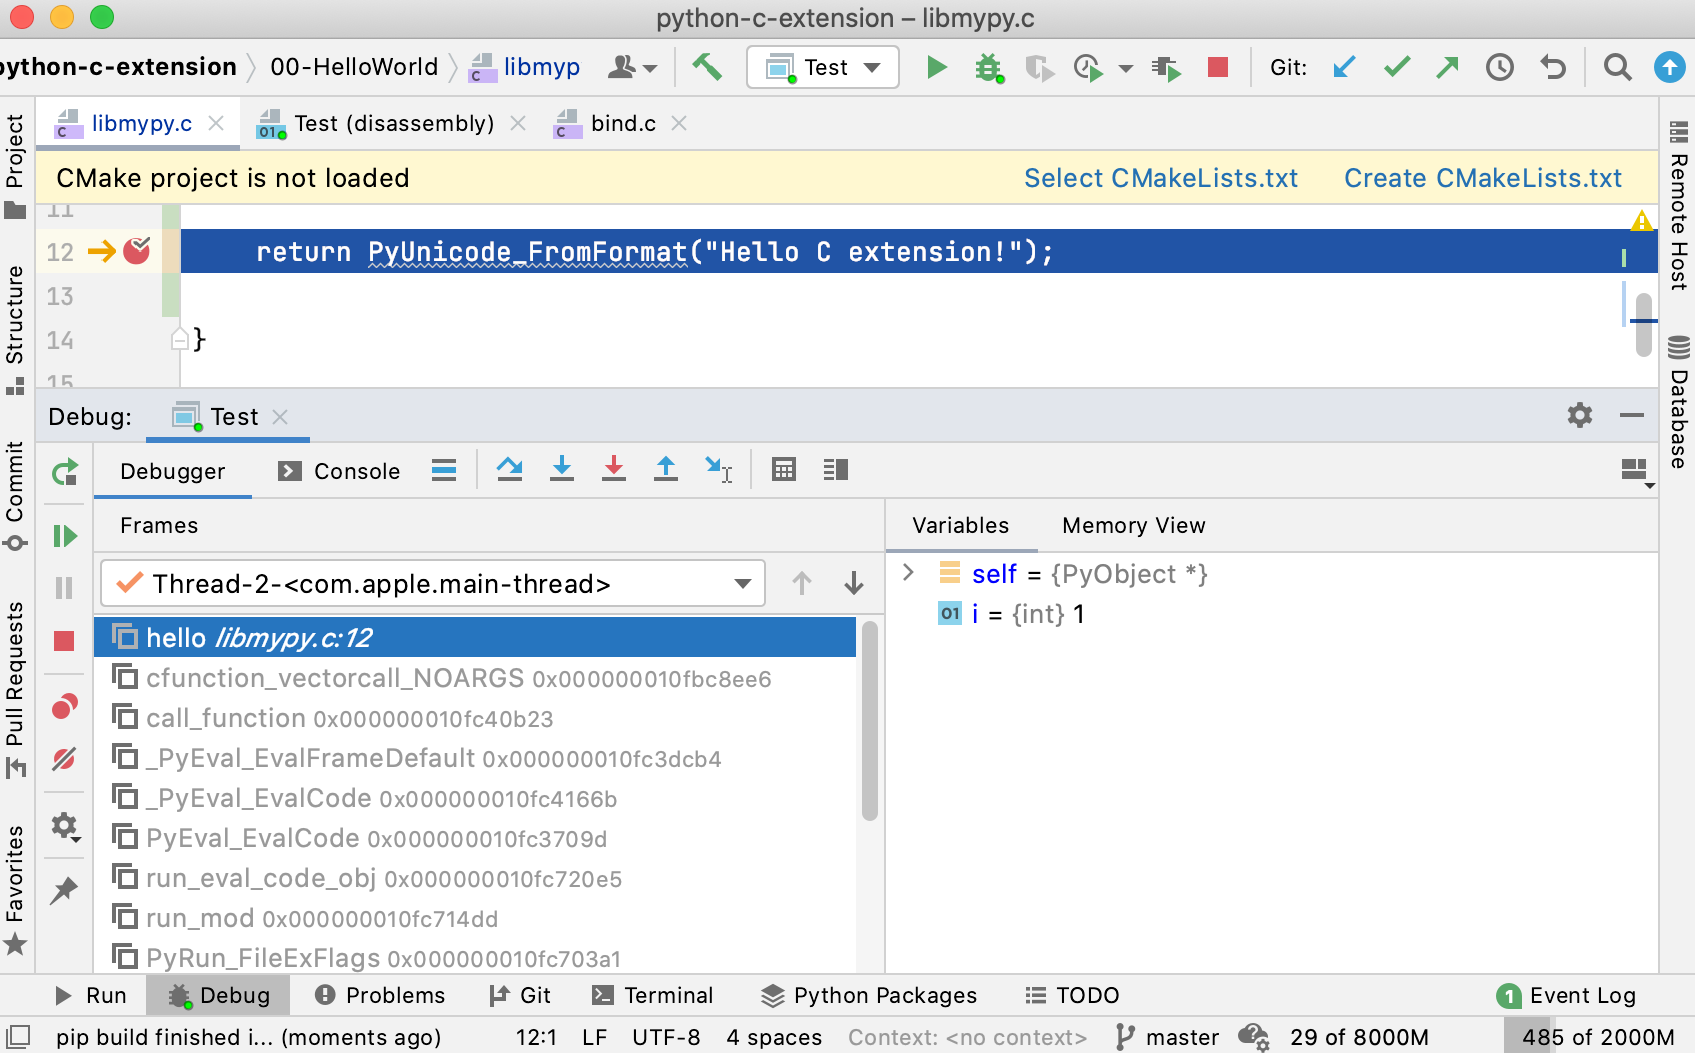
After the debugger is attached successfully, you will be able to debug your native code as usual. For more information, refer to the Debugging section.
When finished, call or click
on the toolbar or in the Debug tool window to detach from the process.
Option 2: Debug a Custom Build Application configuration
As an alternative to attaching the native debugger, you can launch the Python interpreter under it instead. This option is available if you know the exact interpreter command that invokes your script.
You need to create a custom target that will rebuild the native extension and a Custom Build Application configuration that will call the custom target and execute the Python interpreter with proper arguments.
In the main menu, go to Run | Edit Configurations, click
, and select Custom Build Application.
Click Configure Custom Build Targets below the Target field. This will open the dialog.
Click
to add a new target and set the target's name.
Select the toolchain. CLion will use the debugger from the selected toolchain.
Set up the tool for building your project. Click
next to the Build field and then
to add a new tool.
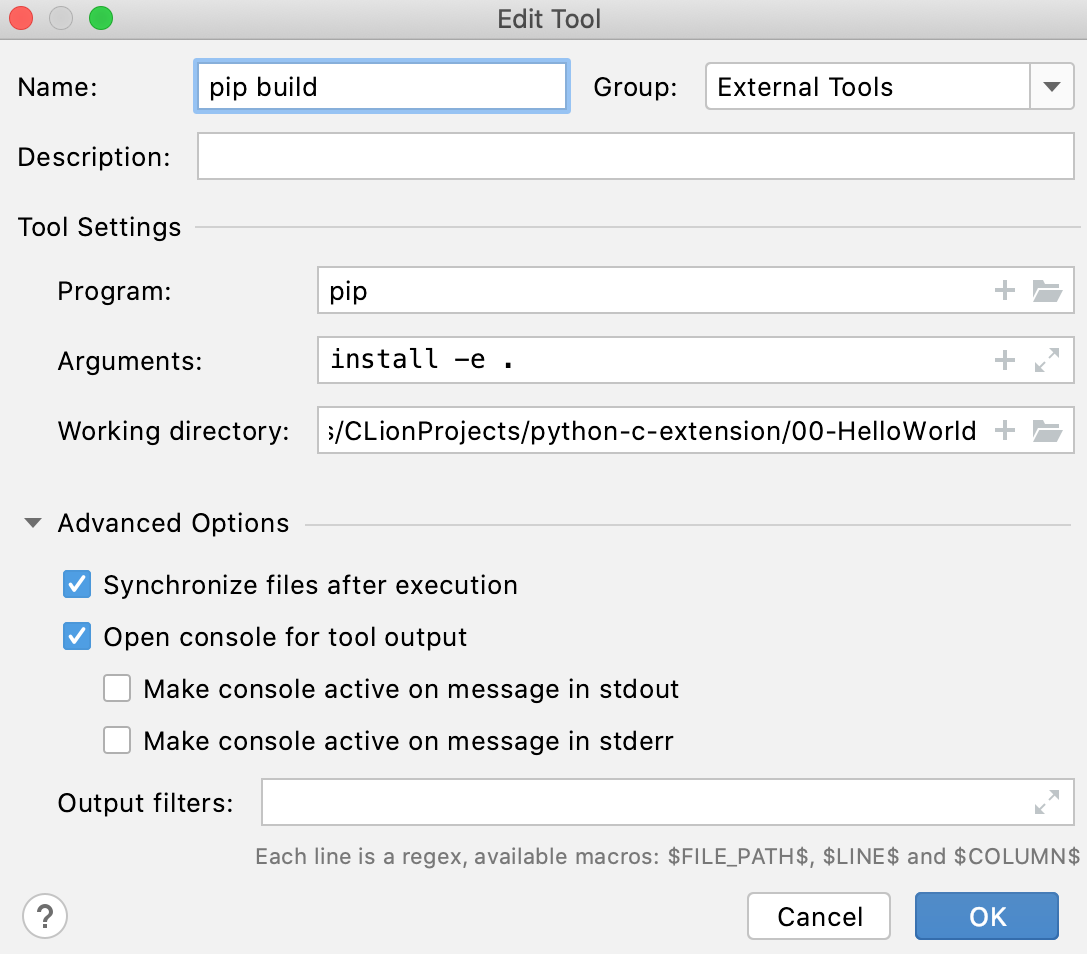
Specify the tool's configuration. The screenshot below illustrates the case of using
pip install -e:
Save the changes in the Edit Tool and Custom Build Targets dialogs, and get back to setting up the run/debug configuration.

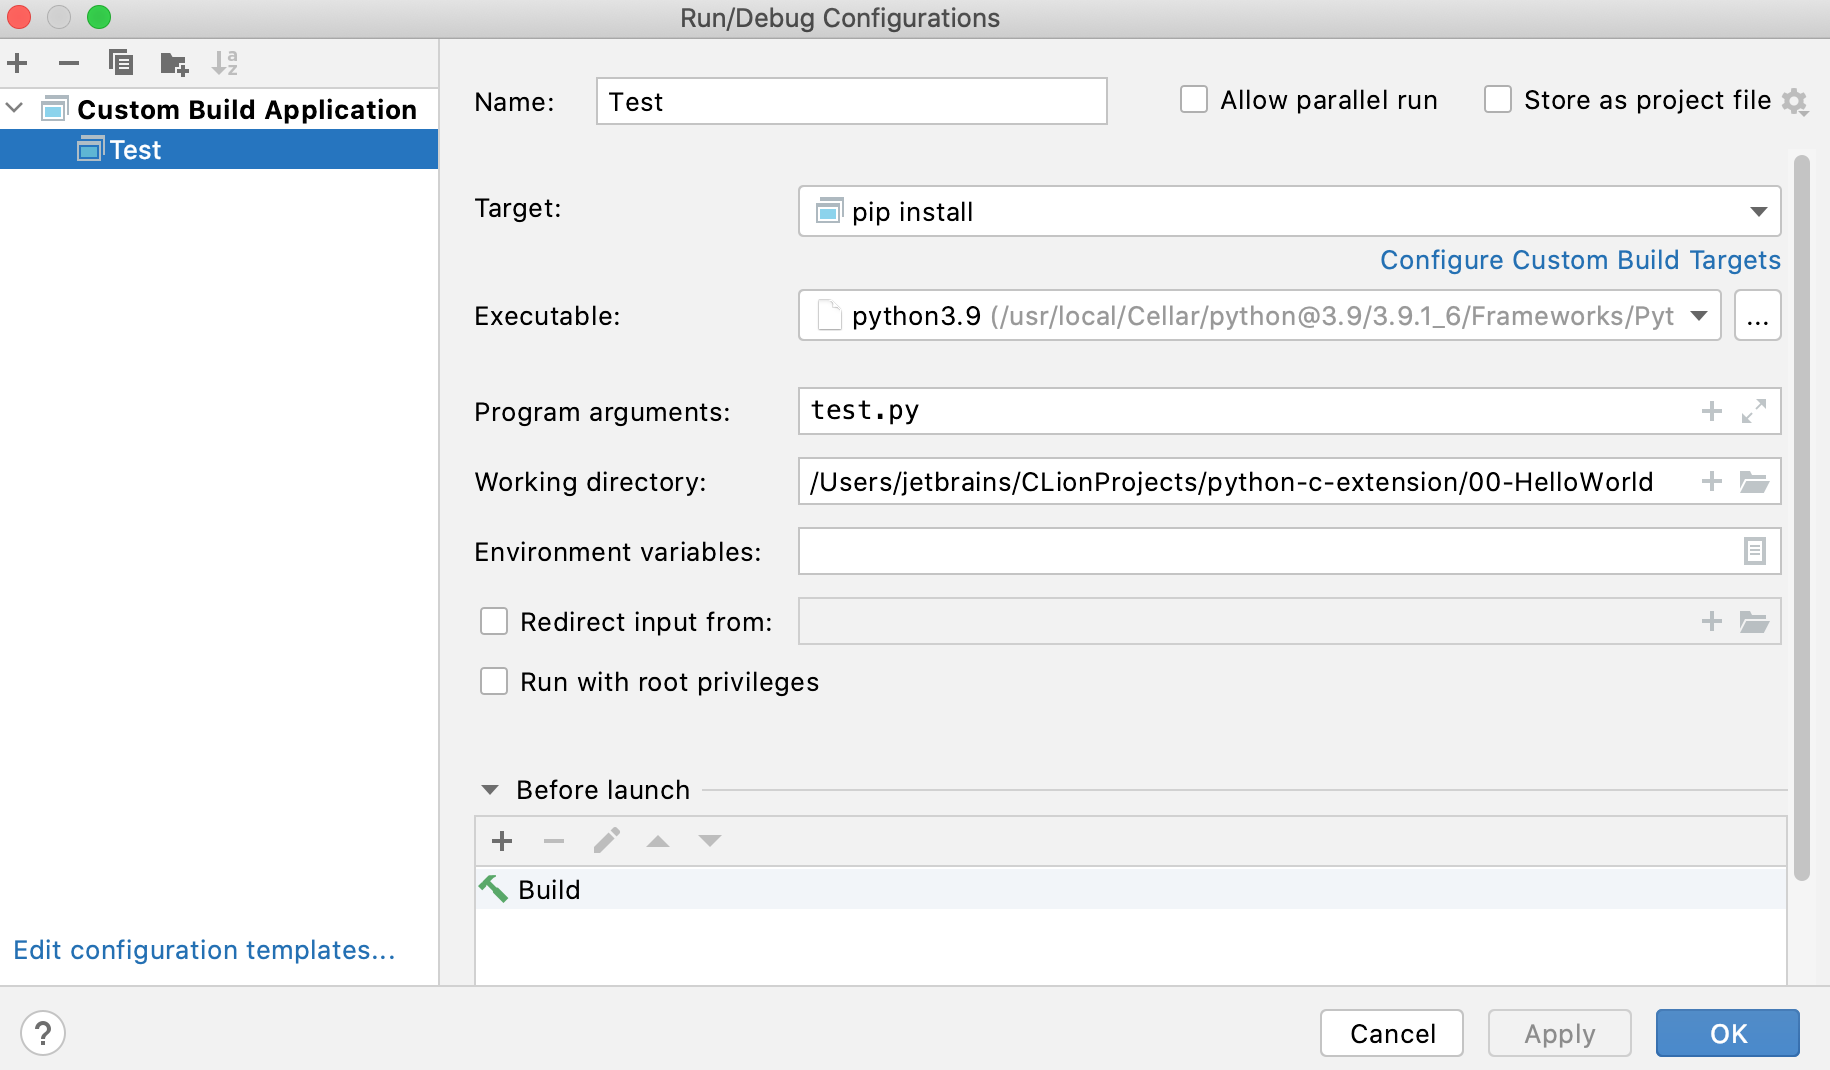
Specify the following settings:
Executable - provide the path to the Python interpreter.
Program arguments - specify the script name with additional arguments if required.
Working directory - set the path to the project root. You can use macros (
) and path variables here.
After saving the configuration, you can start a debug session for it as usual:
