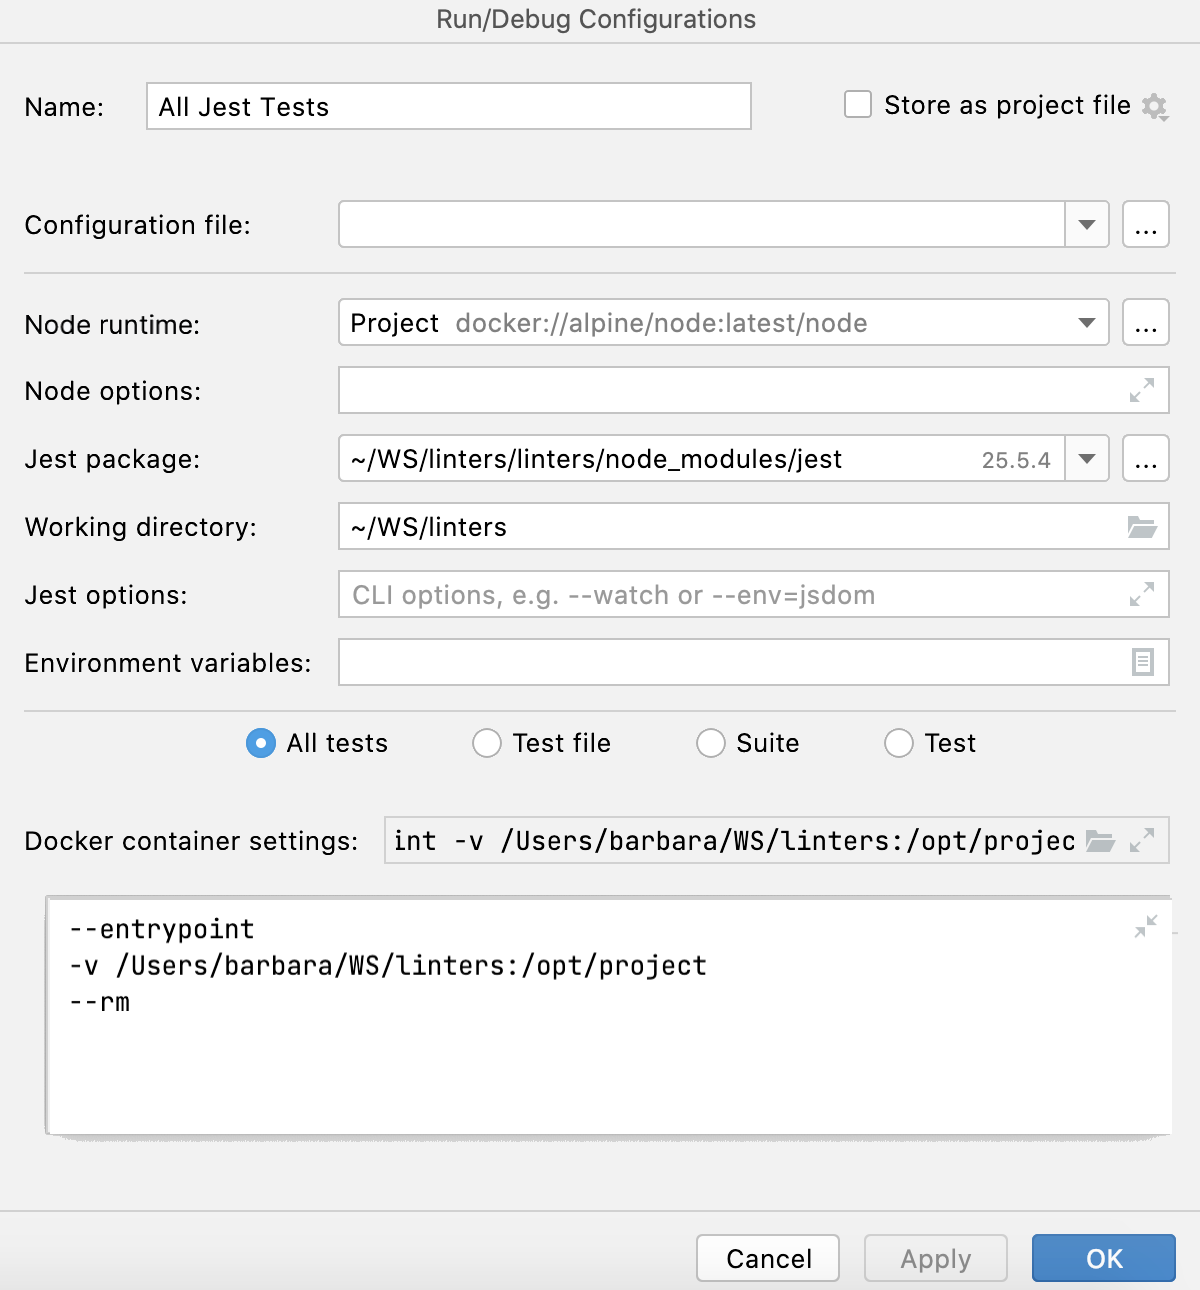
Run/Debug Configuration: Jest
Create:
In this dialog, create configurations for running Jest tests. For more information about creating Vitest tests for JavaScript and TypeScript code, refer to Vitest features on the Vitest official website.
Before you start
Download and install Node.js.
Make sure the JavaScript and TypeScript plugin is enabled in the settings. Press Ctrl+Alt+S to open settings and then select . Click the Installed tab. In the search field, type JavaScript and TypeScript. For more information about plugins, refer to Managing plugins.
Jest-specific configuration settings
Item | Description |
|---|---|
Configuration file | In this field, specify the jest.config.js or jest.config.ts file to use: select the relevant file from the list, or click If the field is empty, CLion looks for a package.json file with a |
Node runtime | In this field, specify the Node.js runtime to use. If you choose the Project alias, CLion will automatically use the project default interpreter from the Node runtime field on the JavaScript Runtime page . In most cases, CLion detects the project default runtime and fills in the field itself. You can also choose another configured local interpreter or click |
Node options | In this field, type the Node.js-specific command-line options to be passed to the Node.js executable file. The acceptable options are:
|
Jest package | In this field, specify the location of the jest, react-scripts, react-script-ts, react-super-scripts, or react-awesome-scripts package. |
Working directory | In this field, specify the working directory of the application. By default, the Working directory field shows the project root folder. To change this predefined setting, specify the path to the desired folder. |
Jest options | In this field, type the Jest CLI options to be passed to Jest. For example, add a |
Environment variables | In this field, optionally specify the environment variables for executing commands. CLion will show these variables in completion lists for  |
Tests | In this area, specify the tests to be executed. The available options are:
|
Docker container settings | This read-only field shows port and volume bindings. Click  |
Docker Compose | In this area, specify the commands and options to be passed to Docker Compose. Accept the default settings or click Check the Command Preview. |
Common settings
When you edit a run configuration (but not a run configuration template), you can specify the following options:
Item | Description |
|---|---|
Name | Specify a name for the run configuration to quickly identify it among others when editing or running. |
Allow multiple instances | Allow running multiple instances of this run configuration in parallel. By default, it is disabled, and when you start this configuration while another instance is still running, CLion suggests stopping the running instance and starting another one. This is helpful when a run configuration consumes a lot of resources and there is no good reason to run multiple instances. |
Store as project file | Save the file with the run configuration settings to share it with other team members. The default location is .idea/runConfigurations. However, if you do not want to share the .idea directory, you can save the configuration to any other directory within the project. By default, it is disabled, and CLion stores run configuration settings in .idea/workspace.xml. |
Toolbar
The tree view of run/debug configurations has a toolbar that helps you manage configurations available in your project as well as adjust default configurations templates.
Item | Shortcut | Description |
|---|---|---|
Alt+Insert | Create a run/debug configuration. | |
Alt+Delete | Delete the selected run/debug configuration. Note that you cannot delete default configurations. | |
Ctrl+D | Create a copy of the selected run/debug configuration. Note that you create copies of default configurations. | |
The button is displayed only when you select a temporary configuration. Click this button to save a temporary configuration as permanent. | ||
Move into new folder / Create new folder. You can group run/debug configurations by placing them into folders. To create a folder, select the configurations within a category, click Then, to move a configuration into a folder, between the folders or out of a folder, use drag or To remove grouping, select a folder and click | ||
Click this button to sort configurations in the alphabetical order. |
Before launch
In this area, you can specify tasks to be performed before starting the selected run/debug configuration. The tasks are performed in the order they appear in the list.
Item | Shortcut | Description |
|---|---|---|
Alt+Insert | Click this icon to add one of the following available tasks:
| |
Alt+Delete | Click this icon to remove the selected task from the list. | |
Enter | Click this icon to edit the selected task. Make the necessary changes in the dialog that opens. | |
Alt+Up Alt+Down | Click these icons to move the selected task one line up or down in the list. The tasks are performed in the order that they appear in the list. | |
Show this page | Select this checkbox to show the run/debug configuration settings prior to actually starting the run/debug configuration. | |
Activate tool window | By default this checkbox is selected and the Run or the Debug tool window opens when you start the run/debug configuration. Otherwise, if the checkbox is cleared, the tool window is hidden. However, when the configuration is running, you can open the corresponding tool window for it yourself by pressing Alt+4 or Alt+5. |