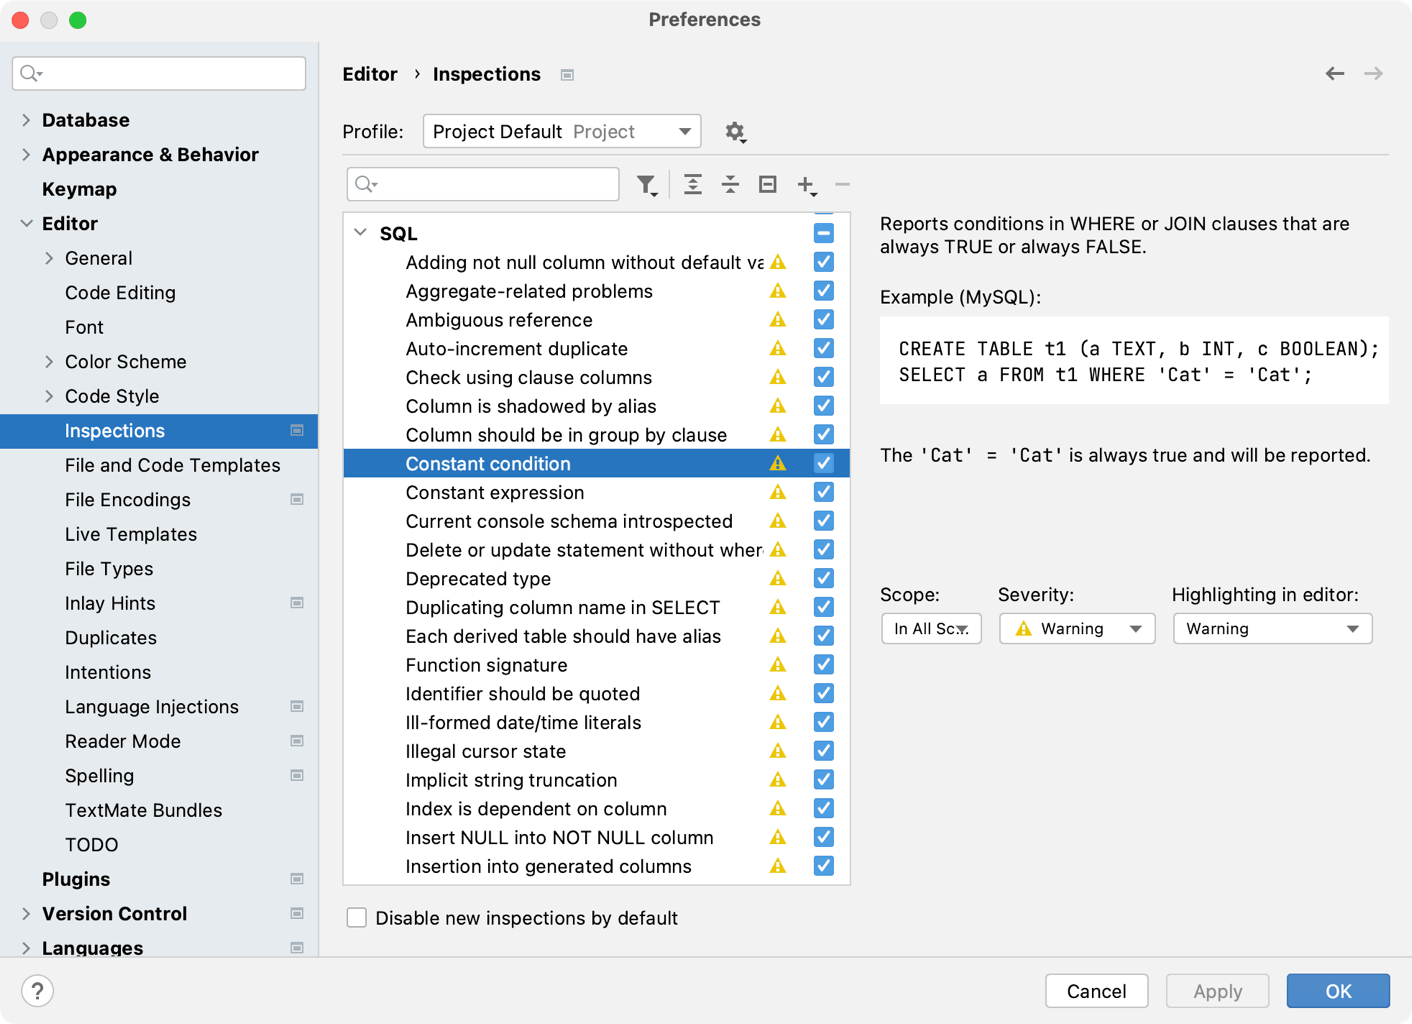
Code inspections
In DataGrip, there is a set of code inspections that detect and correct abnormal code in your project before you compile it. The IDE can find and highlight various problems, locate dead code, find probable bugs, spelling problems, and improve the overall code structure.
Inspections can scan your code in all project files or only in specific scopes (for example, only in production code or in modified files).
Every inspection has a severity level — the extent to which a problem can affect your code. Severities are highlighted differently in the editor so that you can quickly distinguish between critical problems and less important things. DataGrip comes with a set of predefined severity levels and enables you to create your own.
Inspections and their settings are grouped in profiles. Each profile contains the information on the enabled inspections, a scope of files that they analyze, and their severity levels.
The following video gives a short overview of inspections and how they work.
Access all available inspections and their settings
In the Settings dialog (Control+Alt+S), go to .
You can also press Control+Alt+Shift+H and select Configure Inspections in the popup that opens.

Use to filter the inspections list. For example, you can filter inspections by severity or by language.
Examples of code inspections
To see the list of available inspections, open settings Control+Alt+S and navigate to .
An unused subquery item
Detects an unused item in the subquery (for example, a field).

DELETE or UPDATE statements without the WHERE clause
If you forgot to put the WHERE clause in DELETE and UPDATE statements, DataGrip displays a notification to remind you about that. If you omitted the WHERE clause intentionally, you can execute current statements as you planned.
