Optimize Memory Traffic
Sample application | |
In this tutorial, we will see how you can use dotMemory to optimize your application's memory usage.
What do we mean by "optimizing memory usage"? Like any process in the operating system, Garbage Collector (GC) consumes system resources. The logic is simple: the more collections GC has to make, the larger the CPU overhead and the poorer application performance. Typically, this happens when your application allocates a large number of objects that are required for some limited period of time.
To identify and analyze such issues, you should examine the so-called memory traffic. Traffic information shows you how many objects (and memory) were allocated and released during a particular time interval. Let's see how you can determine excessive allocations in your application and get rid of them using dotMemory.
Sample application
Traditionally, the sample application we'll use for this tutorial is Conway's Game of Life. Before you begin, download the application from github.
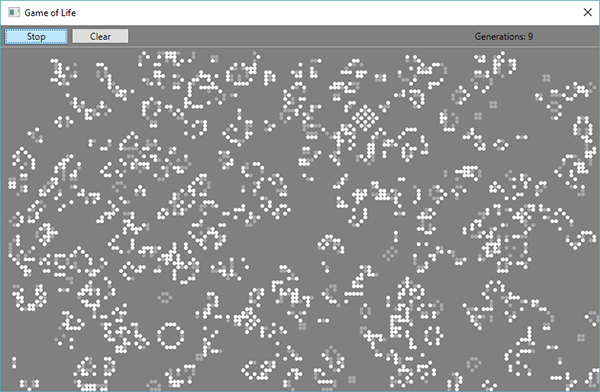
As this application works with a large number of objects (cells), it would be interesting to look at the dynamics of how these objects are allocated and collected.
Step 1. Run dotMemory
Open the Game of Life solution in Visual Studio.
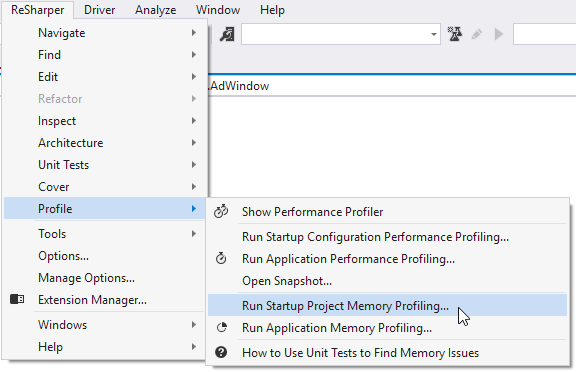
Run dotMemory using the menu .
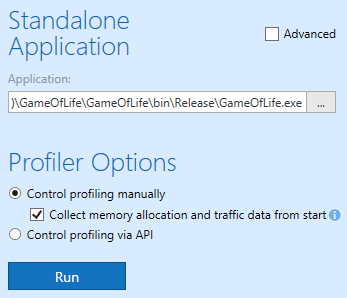
In the opened Profiler Configuration window, select Collect memory allocation and traffic data from start. This will tell dotMemory to start collecting profiling info right after the app is launched. This is how the window should look like after you specify the options:
Click Run to start the profiling session. This will launch our application and open the main Analysis #1 page in dotMemory:
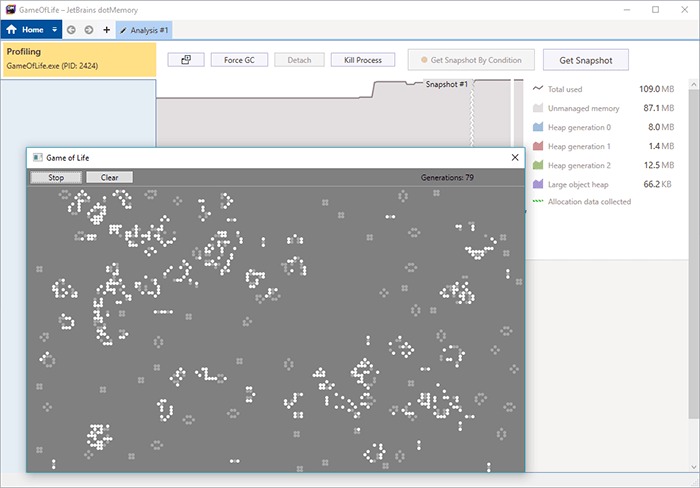
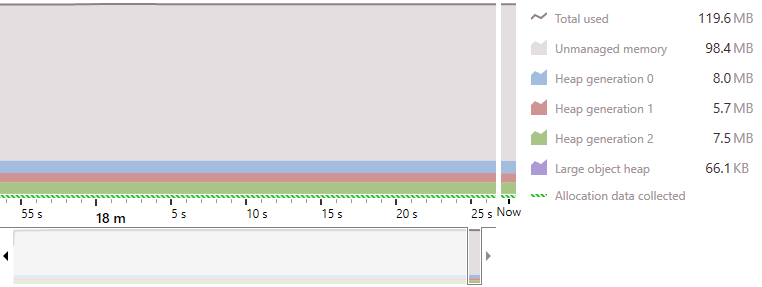
Switch to the dotMemory's main window to see the timeline. The timeline shows you the memory usage of your application in real time. More specifically, it provides details on the current size of unmanaged memory*, Gen0, Gen1, Gen2 heaps and Large Object Heap. Up until Game of Life starts, memory consumption stands still.
Step 2. Get snapshots
After the application is launched, we can start getting memory snapshots. As we want to investigate the dynamics of how our application behaves, we need to take at least two snapshots. The time interval between getting the snapshots will be the subject of further memory traffic analysis.
Naturally, both snapshots must be taken during that part of Game of Life's operation when the majority of allocations occur. Let's take one snapshot at the 30th generation of the Game of Life, and the second one at the 100th generation.
Start the game using the Start button in the application.
When the Generations counter (in the top right-hand corner of our app) reaches 30*, click the Get Snapshot button in dotMemory.
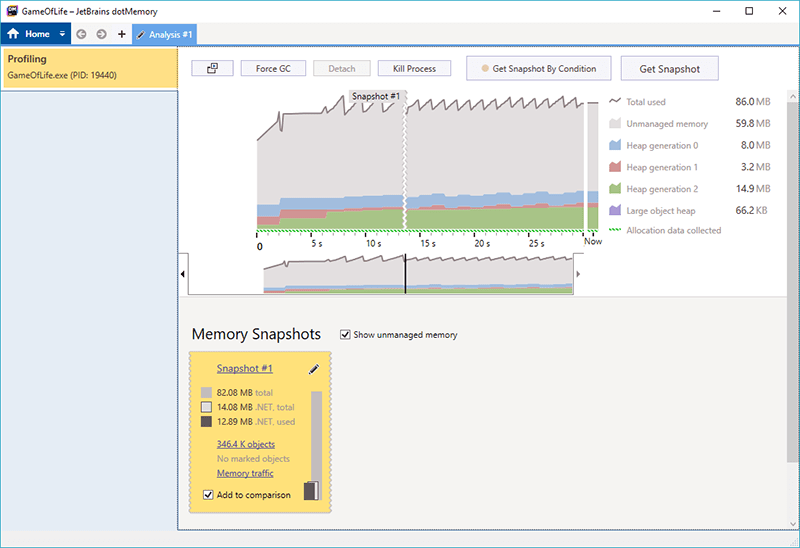
If you now look at the timeline, you'll see how the application consumes memory in real time. When the application allocates new objects, memory consumption increases (Gen0 diagram grows). When garbage collection takes place, memory consumption decreases. As a result, the timeline follows a saw-like pattern.
When the Generations counter reaches 100, get one more snapshot, again by using the Get Snapshot button in dotMemory.
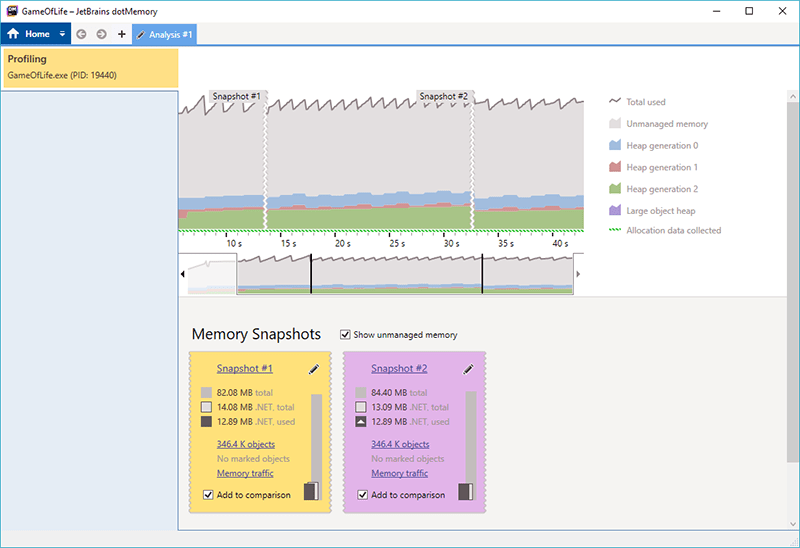
End the profiling session by closing the Game of Life app. The main page now contains two snapshots:
Step 3. Analyze memory traffic
Now, we'll take a look at the memory traffic in the time interval between getting the snapshots.
Make sure both snapshot are added to the comparison area (Add to comparison is selected for both of them):
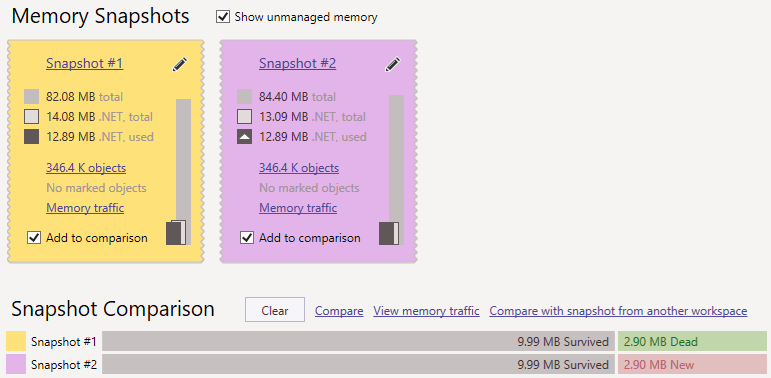
Click View memory traffic in the comparison area This will open the Memory Traffic view. The view shows how many objects of a certain type were created between Snapshot #1 and Snapshot #2.
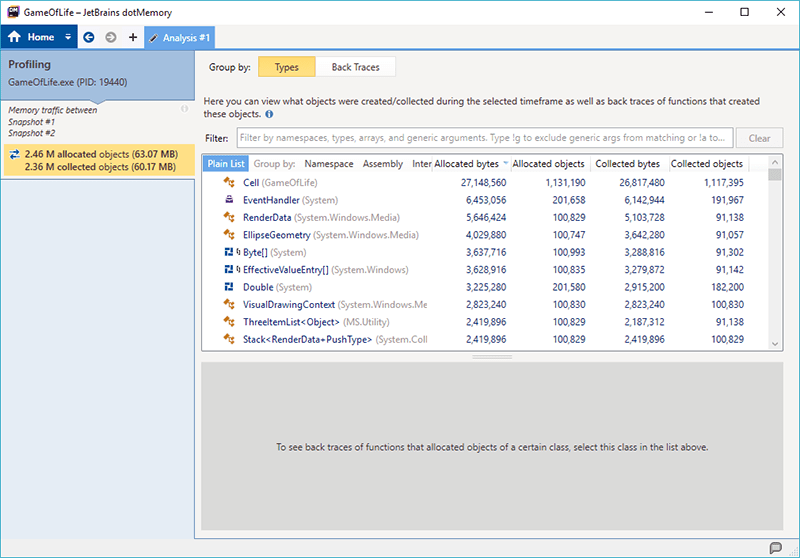
Take a look at the list. 27+ MB, or about 50% of the overall memory traffic, takes place due to the allocation of
GameOfLife.Cell* objects. At the same time, most of these cells, 26+ MB, were collected as well. That's quite strange, since cells should exist for the whole duration of Game of Life. There is no doubt that these collections are hurting our application's performance. Let's check where theseCellobjects come from.Click the row with the
GameOfLife.Cellclass. The list at the bottom of this screen shows us the function (back trace) that created the objects. Apparently, this is theCalculateNextGeneration()method of theGridclass. Let's find it in the code.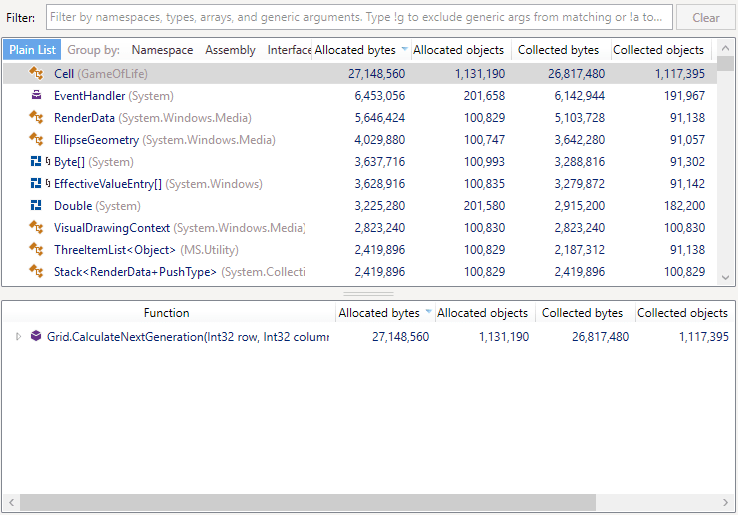
Open the GameOfLife solution in Visual Studio.
Open the Grid.cs file which contains the implementation of the
Gridclass: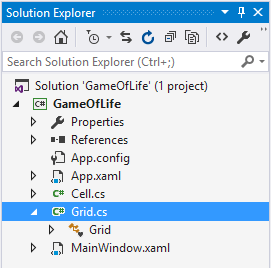
Locate the
CalculateNextGeneration(int row, int column)method:public Cell CalculateNextGeneration(int row, int column) { bool alive; int count, age; alive = _cells[row, column].IsAlive; age = _cells[row, column].Age; count = CountNeighbors(row, column); if (alive && count < 2) return new Cell(row, column, 0, false); if (alive && (count == 2 || count == 3)) { _cells[row, column].Age++; return new Cell(row, column, _cells[row, column].Age, true); } if (alive && count > 3) return new Cell(row, column, 0, false); if (!alive && count == 3) return new Cell(row, column, 0, true); return new Cell(row, column, 0, false); }It appears that this method calculates and returns the
Cellobjects for each next generation of Game of Life. But this doesn't explain high memory traffic. Let's return to dotMemory and find out what function calls theCalculateNextGenerationmethod.In dotMemory, expand the
CalculateNextGenerationmethod to see the next function in the stack. It is theUpdatemethod of theGridclass:
Find this method in the code:
public void Update() { for (int i = 0; i < SizeX; i++) { for (int j = 0; j < SizeY; j++) { _nextGenerationCells[i, j] = CalculateNextGeneration(i,j); } } UpdateToNextGeneration(); }This finally sheds light on the causes of our high memory traffic. There is the
nextGenerationCellsarray of theCelltype which stores cells for the next generation of Game of Life. On each generation update, cells in this array are replaced with new ones. Cells left from previous generation are no longer needed and get collected by GC after some time. Obviously, there's no need to fill the_nextGenerationCellsarray with new cells each time as the array exists during the entire lifetime of the application. To get rid of high memory traffic, we need to update the properties of existing cells with new values instead of creating new cells. Let's do this in the code.Actually, as our application is a learning example, it already contains the required implementation of the
CalculateNextGenerationmethod. This method updates a cell'sIsAliveandAgefields sent by reference:public void CalculateNextGeneration(int row, int column, ref bool isAlive, ref int age) { ... }To fix the issue, uncomment the lines in
Update()that update the_nextGenerationCellsarray using this method. Finally, theUpdate()method should look as follows:public void Update() { bool alive = false; int age = 0; for (int i = 0; i < SizeX; i++) { for (int j = 0; j < SizeY; j++) { CalculateNextGeneration(i, j, ref alive, ref age); _nextGenerationCells[i, j].IsAlive = alive; _nextGenerationCells[i, j].Age = age; } } UpdateToNextGeneration(); }Now, let's apply these changes and check how they affect the memory traffic.
Build the application one more time. Repeat the steps described in Step 1. Run dotMemory and Step 2. Get snapshots to get two new snapshots.
Open the Memory Traffic view to see the memory traffic between the collected snapshots (as described in Sub-steps 1 and 2 in Step 3. Analyze memory traffic):
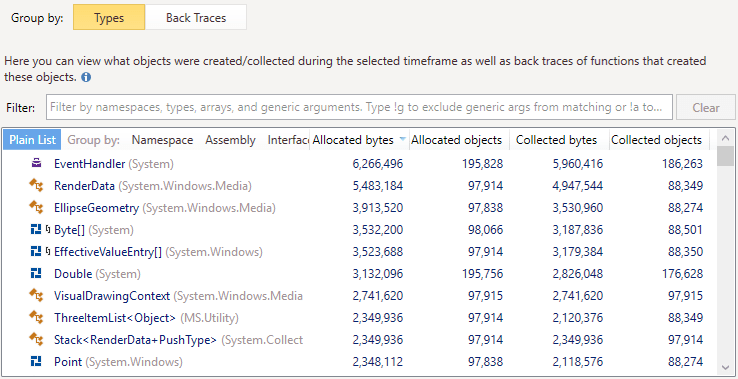
The
GameOfLife.Cellclass is no longer on the list! This resulted in a 40% drop in the overall traffic (down to 33 MB), which is a very good optimization.