Troubleshooting
Last modified: 30 January 2025If you stumble upon a problem while working with IDE Services, make sure to contact the IDE Services support team. If possible, we recommend including the following information in your report:
Screenshots or a screencast demonstrating the problem in the user interface
Logs from the Toolbox App and your IDE
A tbe_diagnostics.json file from your IDE
Server-side logs
Logs and diagnostic data
Collect Toolbox App logs
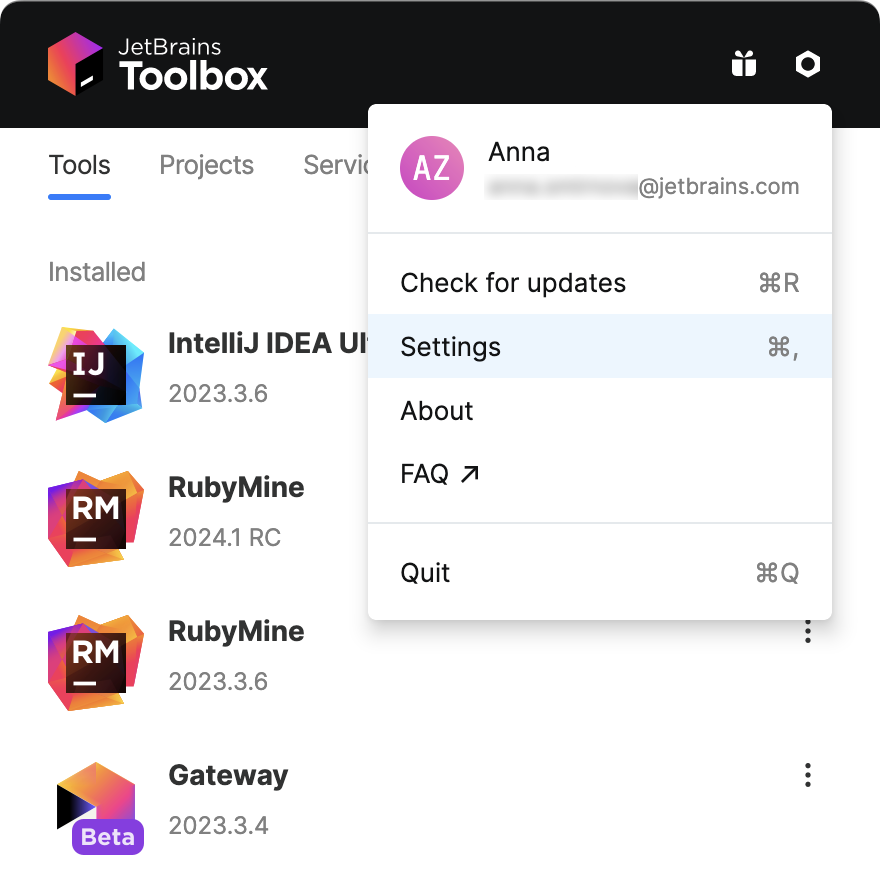
In the Toolbox App, click the locknut icon in the upper right corner and select Settings .

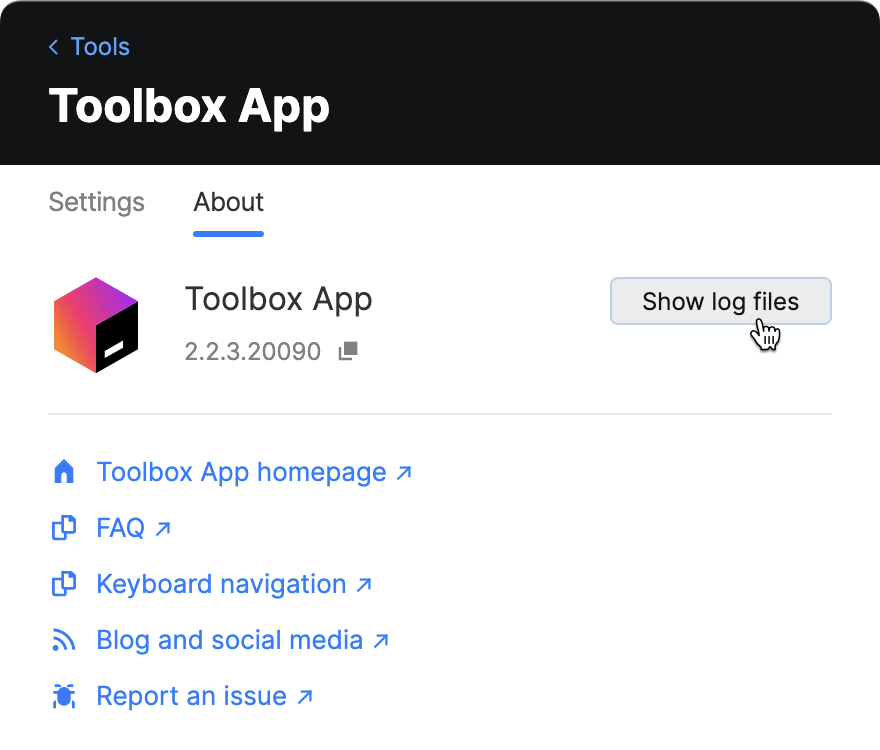
Navigate to the About tab and click the Show log files button.

As an alternative, you can find Toolbox App logs in your file system:
macOS:
~/Library/Logs/JetBrains/Toolbox/Windows:
<SYSTEM_DRIVE>\Users\<USER_ACCOUNT_NAME>\AppData\Local\JetBrains\Toolbox\logsLinux:
~/.local/share/JetBrains/Toolbox/logs/
Collect IDE logs
The log file is called idea.log and is rotated based on its size. When submitting an issue, it's recommended to zip and attach the most recent log files.
Navigate to the product log file from the IDE
From the main menu, select Help and choose one of the following menu items:
Show Log in Explorer (for Windows and Linux)
Show Log in Finder (for macOS)
tip
You can also select Help | Collect Logs and Diagnostic Data to generate a ZIP file with all the log files, including build logs and automatic thread dumps.
As an alternative, you can find IDE logs in your file system:
macOS:
~/Library/Logs/JetBrains/<IDE_NAME_AND_VERSION>Windows:
%LOCALAPPDATA%\JetBrains\<IDE_NAME_AND_VERSION>\logLinux:
~/.cache/JetBrains/<IDE_NAME_AND_VERSION>/log
Collect IDE Services diagnostic data in IDEs
In your IDE, press Shift twice to open the Search Everywhere dialog.
Start typing
Collect JetBrains IDE Services Diagnostics Dataand select the action from the list.
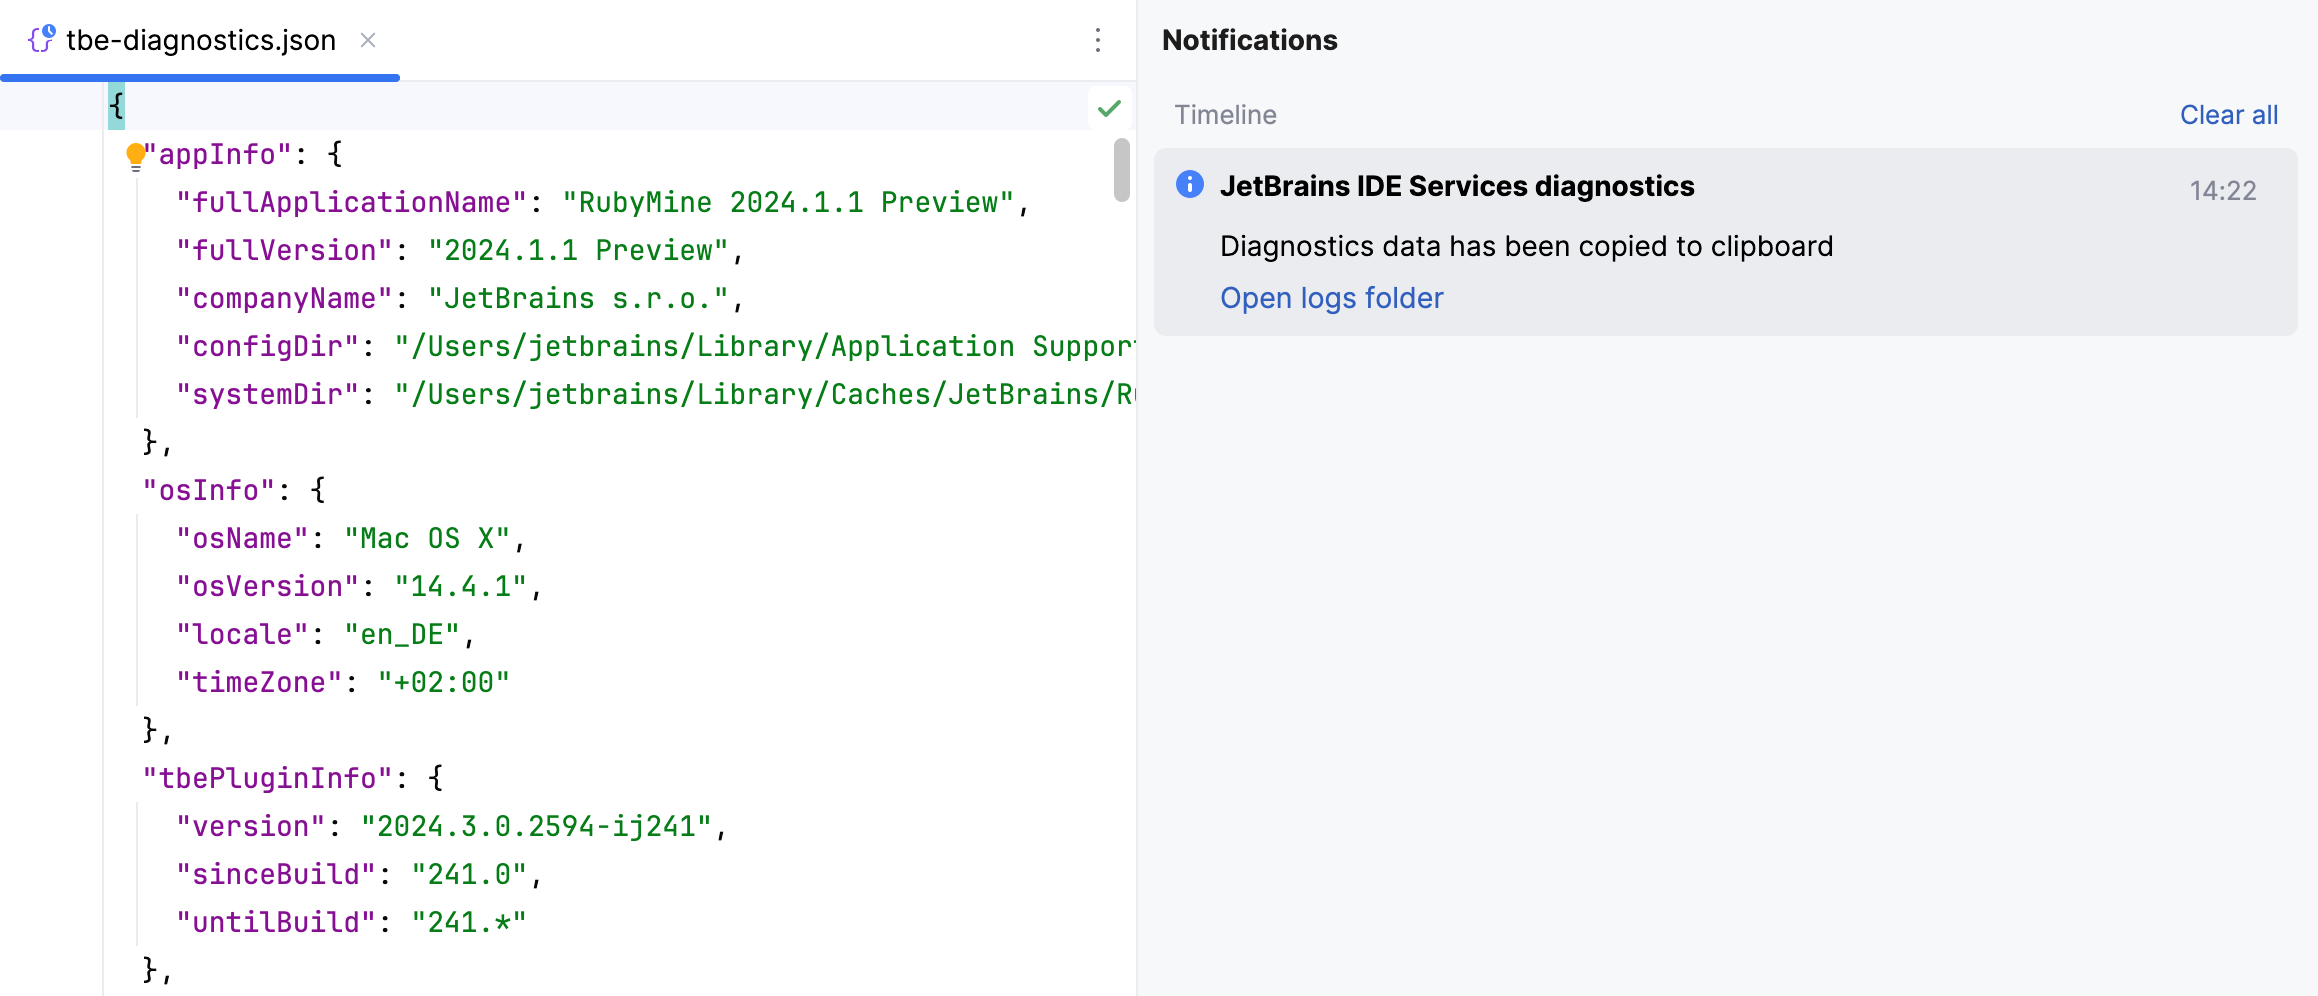
Your IDE will create a scratch tbe-diagnostics.json file, open it in the editor, and copy its contents to the clipboard.

Collect server-side logs
Depending on the deployment option in use, provide the support team with the following information:
Cloud deployment (AWS, GoogleCloud, Azure)
The cloud log processor output for the necessary time period
Kubernetes (on premises)
The time-series log offload from your centralized logging solution (Grafana, Prometheus, Datadog, and so on)
If no logging solution is present, run the following command to collect logs:
kubectl logs <IDE_Services_pods>
Docker (on premises)
The Stream container output exported to a file
Alternatively, run the following command:
docker logs <container_id>To obtain the container ID, run the following command:
docker ps
Change the application's logging level
The support team may ask you to change the logging level of your application to gain more insights.
In your server configuration file, change the logging configuration as follows:
application.yamlvalues.yaml (Helm)logging: level: root: INFO # can be changed to WARN/DEBUG/TRACElogging: level: root: INFO # can be changed to WARN/DEBUG/TRACE
Safe mode
Safe mode is a temporary fallback mechanism that ensures continued access to JetBrains IDEs when the IDE Services Server or other critical services (such as a PostgreSQL database, object storage, or authentication provider) are unavailable. It is intended for emergency use only and can be enabled solely with the assistance of the IDE Services support team.
To enable safe mode, the support team issues a special safe mode key. By registering this key as an environment variable, your organization’s developers can continue using JetBrains IDEs for up to 72 hours from the moment the key is issued. During this time, the support team will work urgently to resolve underlying issues.
warning
Exercise caution while using safe mode and treat it as a short-term measure, as it comes with a number of limitations and requirements:
Only License Vault remains active. All other IDE Services products stop functioning.
Developers can't download new IDE binaries or plugins. They can only use what is already installed on their machines.
A valid IDE Services license must be activated beforehand. Without this, a safe mode key can't be generated.
Enable safe mode
Contact the IDE Services support team, describe your current issues, and provide them with your License ID.
tip
You can locate your License ID in the Web UI by navigating to Configuration | License & Activation.
The IDE Services support team generates a safe mode key for you. Add a
SAFEMODE_KEYenvironment variable and use the provided key as its value.The exact steps to register an environment variable depend on your deployment method. Examples:
Kubernetes (Helm)Kubernetes (kubectl)Docker (Google Cloud Run)Add the following configuration to the values.yaml file:
ides:
  ...
  config:
    additionalEnvs:
      - name: SAFEMODE_KEY
        value: "YOUR_SAFE_MODE_KEY"
Run the following command:
kubectl set env deployments/<YOUR_IDE_SERVICES_DEPLOYMENT> SAFEMODE_KEY=<YOUR_SAFE_MODE_KEY>Use one of the options described in the Google Cloud documentation.
Restart your IDE Services Server. For more details, refer to the instructions for Docker and Kubernetes installations.
Your IDE Services Server will run in safe mode and operate as a License server. If necessary, provide instructions to your developers on how to activate IDE licenses manually.
Once the issue with your IDE Services instance is resolved, you can proceed with reverting the configuration changes and restarting the IDE Services Server to restore full functionality.