Read the profiling reportUltimate
Navigate the report
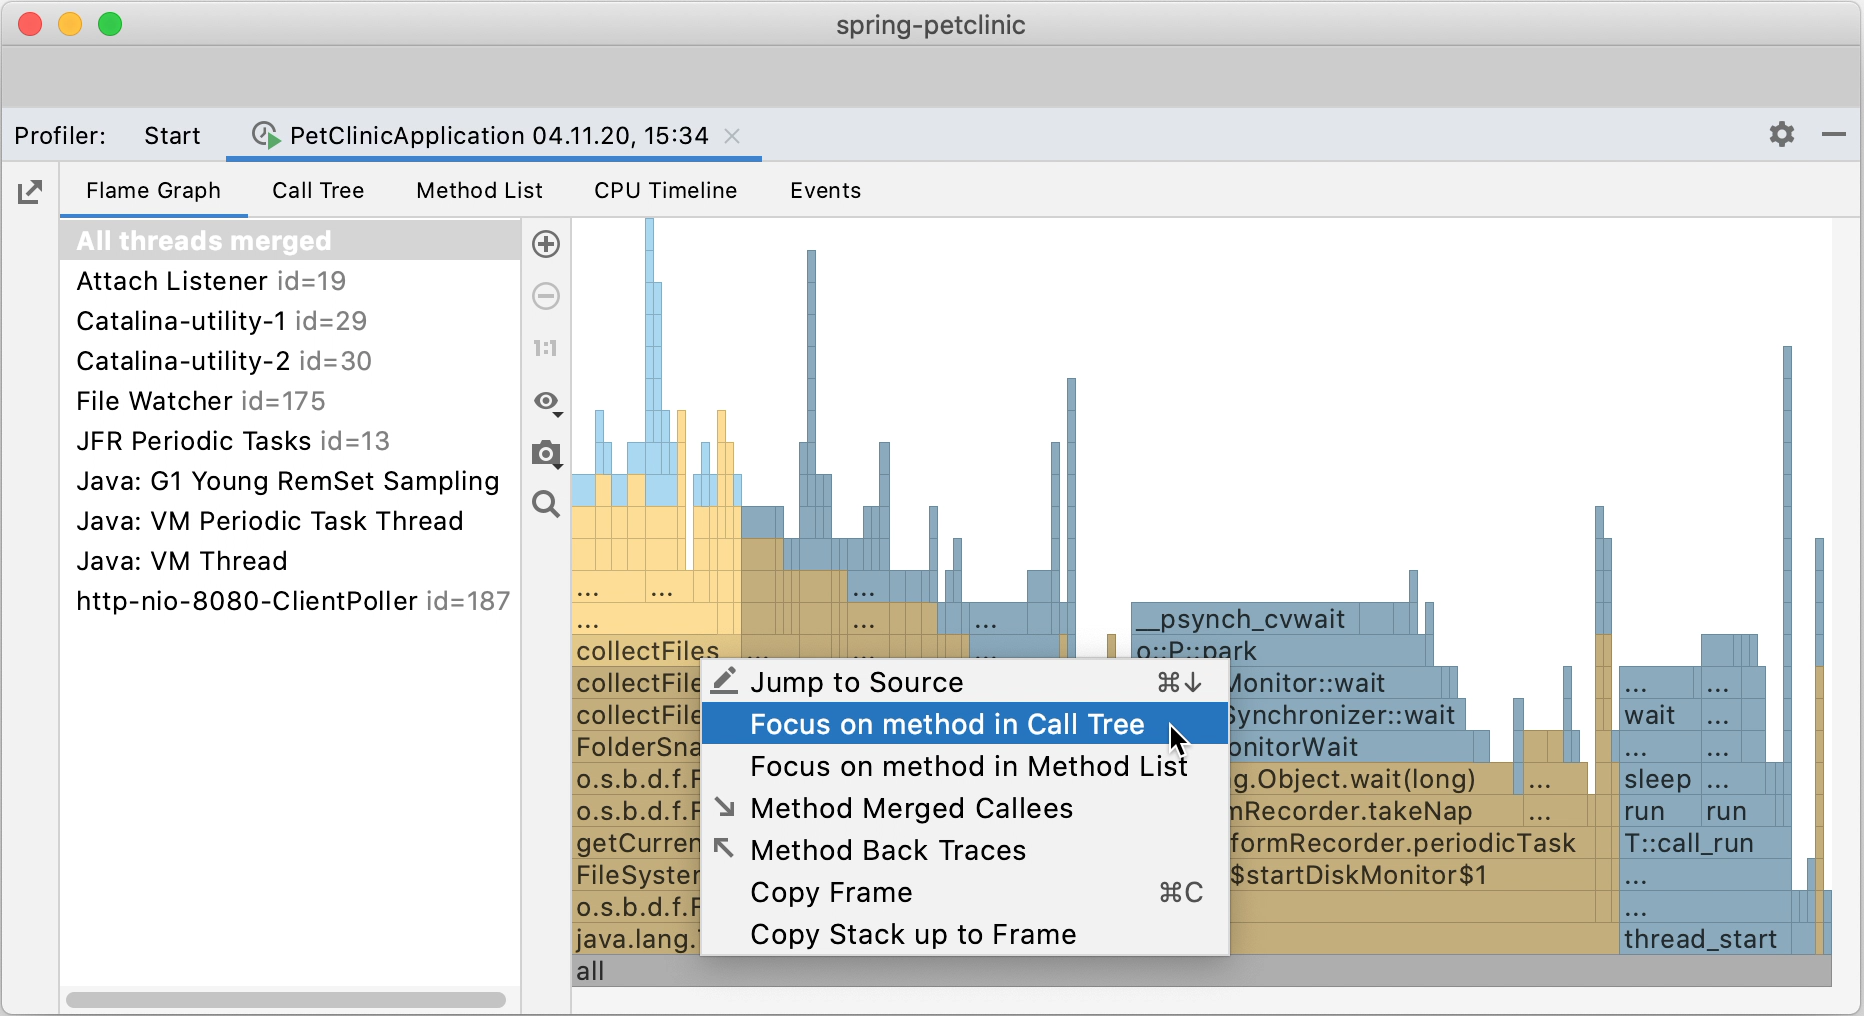
Flame Graph

When you read the flame graph, focus on the widest blocks. These blocks are the methods that are presented in the profile most. You can start from the bottom and move up, following the code flow from parent to child methods, or use the opposite direction to explore the top blocks that show the functions running directly on the CPU. In this case, you can use the ![]() option change the graph view.
option change the graph view.
Zoom the graph
Use the
 and
and  options to zoom the graph.
To focus on a specific method, double-click the corresponding block on the graph.
To restore the original size of the graph, click 1:1.
Search the graph
If you want to locate a specific method on the graph, start typing its name or click
 and type the name in the search bar.
The graph highlights all blocks with method names matching your search request.
Use
 and
and  for fast navigation between search results. You can also search either in the whole graph or just in a specific subtree.

Capture the graph
Click
 and select Copy to Clipboard or click Save to export the graph as an image in the .png format.
tip
For more information about flame graphs, see Flame Graphs.
Call Tree

tip
To toggle the percentage to the parent's call view, click
and select Show Percent of Parent.
Filter Call Tree results

tip
To quickly disable filtering, click
Collapse recursive calls

Folded recursive calls are marked with the ![]() icon on the Call Tree tab. Click it to open the recursive call tree in a separate tab. You can preview the number of merged stacks in a tooltip.
icon on the Call Tree tab. Click it to open the recursive call tree in a separate tab. You can preview the number of merged stacks in a tooltip.

What-if: focus on specific methods

Method List

CPU Timeline
The toolbar on the left allows you to zoom in ![]() and zoom out
and zoom out ![]() the timeline.
the timeline.

Click ![]() | Show Chart on the toolbar to display the CPU load graph (currently supported only for Java Flight Recorder).
| Show Chart on the toolbar to display the CPU load graph (currently supported only for Java Flight Recorder).

Java Flight Recorder Events
