Run with a profilerUltimate
note
The CPU and memory profiling options are available only on macOS and Linux. Java Flight Recorder is supported on OpenJDK 11 and later, Oracle JDK 11 and later, and Oracle JDK 8-10 if a VM option is specified.
Configure the directory for snapshots
By default, snapshots are stored in the user home directory. To save snapshots to a different directory:
Open the Start page of the Profiler tool window and click the Set snapshot folder button.

Choose the directory and click OK.

Run with a profiler
Click the
icon in the gutter next to the entry point of the application that you want to profile and select the necessary profiling option: CPU, memory, or Java Flight Recorder.

Profile a run configuration
At the moment, you can profile the most common run configurations. Application server run configurations are currently not supported, except the local Tomcat run/debug configuration.
Select a run configuration from the list on the toolbar.
If the list is empty or the necessary configuration is not created yet, refer to Run/debug configurations for instructions on how to create one.
Click
next to
and select the necessary profiling option: CPU, memory, or Java Flight Recorder.

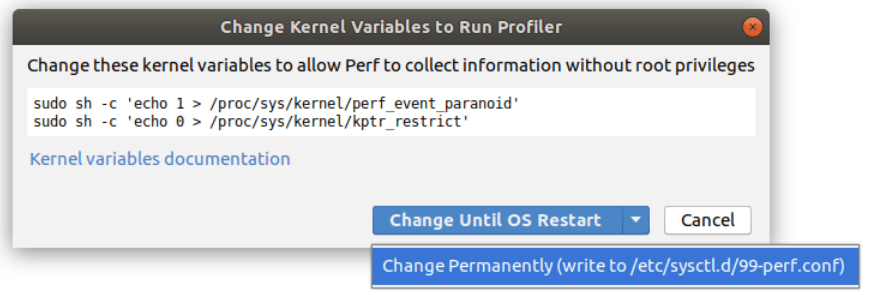
(Only for Async Profiler on Linux) Upon the first launch of the profiler, IntelliJ IDEA checks whether kernel variables are already set up and suggests the necessary changes:

Attach a profiler to a running process
You can attach a profiler to a running process or capture a snapshot of its memory right from the Profiler tool window.
From the main menu, select View | Tool Windows | Profiler.
In the Profiler tool window, you will see the list of running processes.
Right-click the necessary process.
For a memory dump, select Capture Memory Snapshot. For profilers, select Attach Profiler to Process and select the profiling type: CPU, Allocation Profiler, or Java Flight Recorder.

tip
You can also attach the necessary profiler from the main menu: select Run | Attach Profiler to Process.
Profile Maven goals
In IntelliJ IDEA, you can profile several goals:
Maven Failsafe Plugin:
failsafe:integration-testMaven Surefire Plugin:
surefire:testExec Maven Plugin:
exec:execandexec:javaMake sure to specify the
mainClassargument forexec:java. You can do that in your pom.xml or in the Command line field in the corresponding run/debug configuration. For more information, refer to the Exec Maven Plugin documentation.
From the main menu, select View | Tool Windows | Maven.
In the Maven tool window, right-click the goal that you want to profile and select the necessary profiling option: CPU, memory, or Java Flight Recorder.

IntelliJ IDEA creates a temporary run configuration that you can save and rerun later.
If you already have a Maven run/debug configuration for the required goal, you can profile it the same way as any other run configuration.
Limitations
Currently, there are several limitations for profiling Maven goals:
Profiling tools in IntelliJ IDEA do not support Maven profiles, executions, and versions. That is why, some complex configurations might not profile correctly.
Profiling of specific versions of the mentioned goals is not supported (for example:
org.codehaus.mojo:exec-maven-plugin:3.0.0:exec).You cannot profile the goals if they are configured in a way that more than one process is created during their execution.
Profiling of the
exec:exec,surefire:test, andfailsafe:integration-testgoals is possible only in projects without modules. You can, however, profile a specific module provided that it has no sub-modules.Profiling is not possible if there are certain arguments in a plugin configuration:
commandlineArgsin theexec:execplugin configurationdebugForkedProcessin thesurefire:testandfailsafe:integration-testplugin configurations
If the Exec Maven Plugin configuration has
<arguments>in pom.xml, the values in<arguments>are skipped during the execution of theexec:execgoal.
Stop profiling and get results
When the profiling data is ready, you will see a confirmation popup together with the Profiler tool window bar. Click this bar to open the Profiler tool window or go to View | Tool Windows | Profiler if you don't use tool window bars.

Alternatively, go to View | Tool Windows | Profiler, wait for Java Flight Recorder to collect enough data, and click Stop Profiling and Show Results.

When the analysis is finished, you can review and analyze the reports.