Analyze Java Stream operations
Java Streams may sometimes be difficult to debug. This happens because they handle the processing logic behind the scenes, and it might complicate tracing how particular values are derived. To help you debug Java Streams, IntelliJ IDEA lets you visualize what is going on in a Java Stream.
Let's take a simple program written in functional style to demonstrate how the feature works.
As the classes' names suggest, the app finds prime numbers. You can specify the starting number and the number of candidates to check using the program arguments. The checking logic is handled by a Java 8 Stream.
Now if we look at the program output, we see extra numbers there.
To understand where these incorrect numbers are coming from, let's use the stream debugger feature.
Suspend the program at a line where the stream is used. You can use any stream operation for this including terminal ones.
public static void main(String[] args) { if (args.length >= 1) skip = Integer.parseInt(args[0]); if (args.length >= 2) limit = Integer.parseInt(args[1]); IntStream.iterate(1, n -> n + 1) // set breakpoint here .skip(skip) .limit(limit) .filter(PrimeTest::isPrime) .forEach(System.out::println); }In the Debug tool window's toolbar, click More
then select Trace Current Stream Chain
.
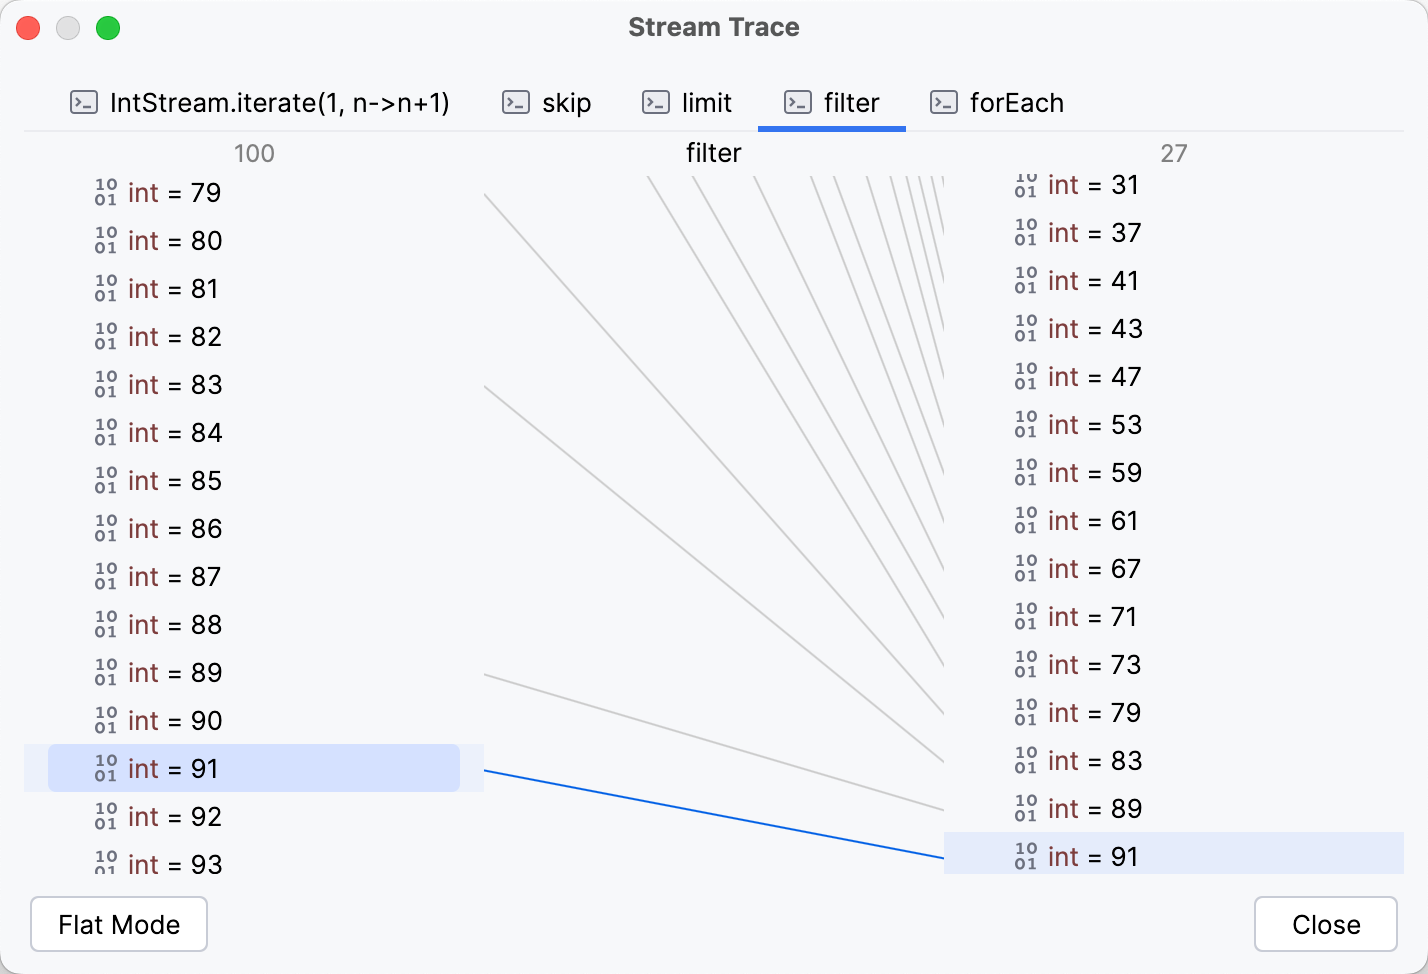
Use the Stream Trace dialog to analyze the operations inside the stream. The tabs in the top part let you switch between particular operations and see how the values are transformed with each operation.

The examination of the stream shows that the extra value is coming from the filter operation. The search of a bug is now narrowed down to the Predicate of filter, or more specifically, PrimeTest.isPrime() method.