Debug asynchronous code
Debugging asynchronous code is a challenge because the tasks are often scheduled in one thread and executed in another. Every thread has its own stack trace, making it difficult to figure out what happened before the thread started.
IntelliJ IDEA makes it easier by establishing a connection between frames in different threads. This allows you to look back from a worker thread to the place where the task was scheduled and debug the program as if the execution was all in the same thread.
To try async stack traces, debug the following example:
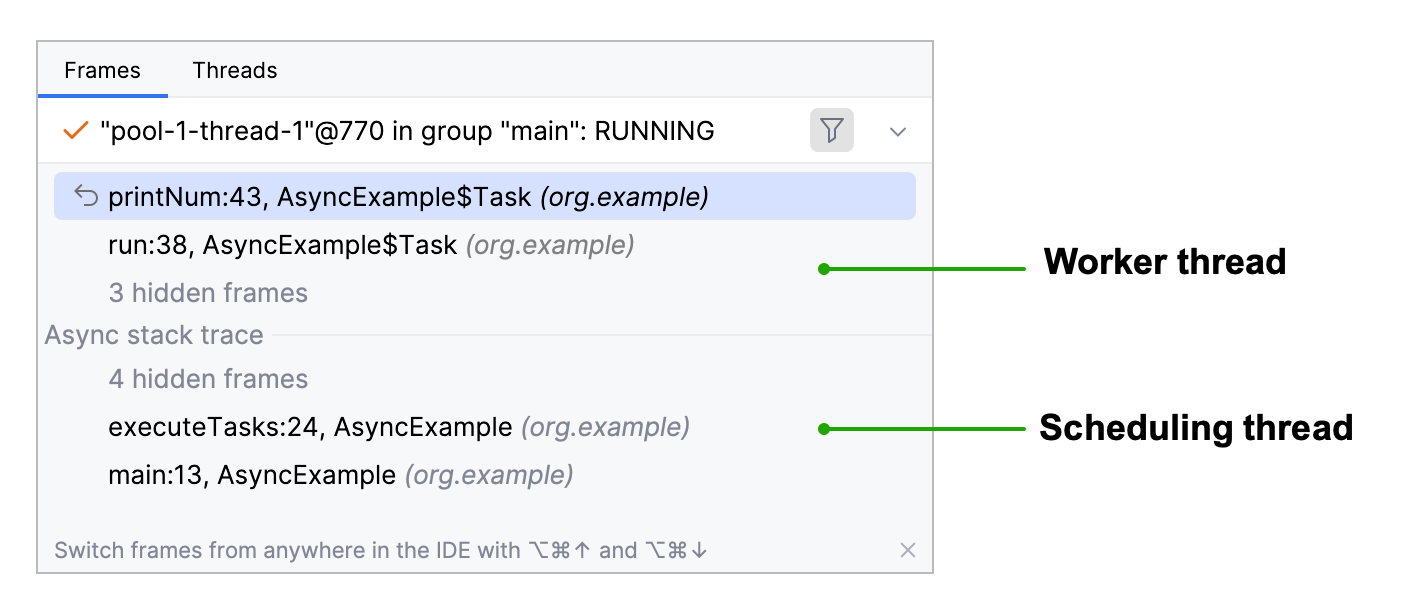
When we stop at the breakpoint in the printNum() method, there are two stacktraces available to us:
The current thread (worker)
The main thread (where the task was scheduled)

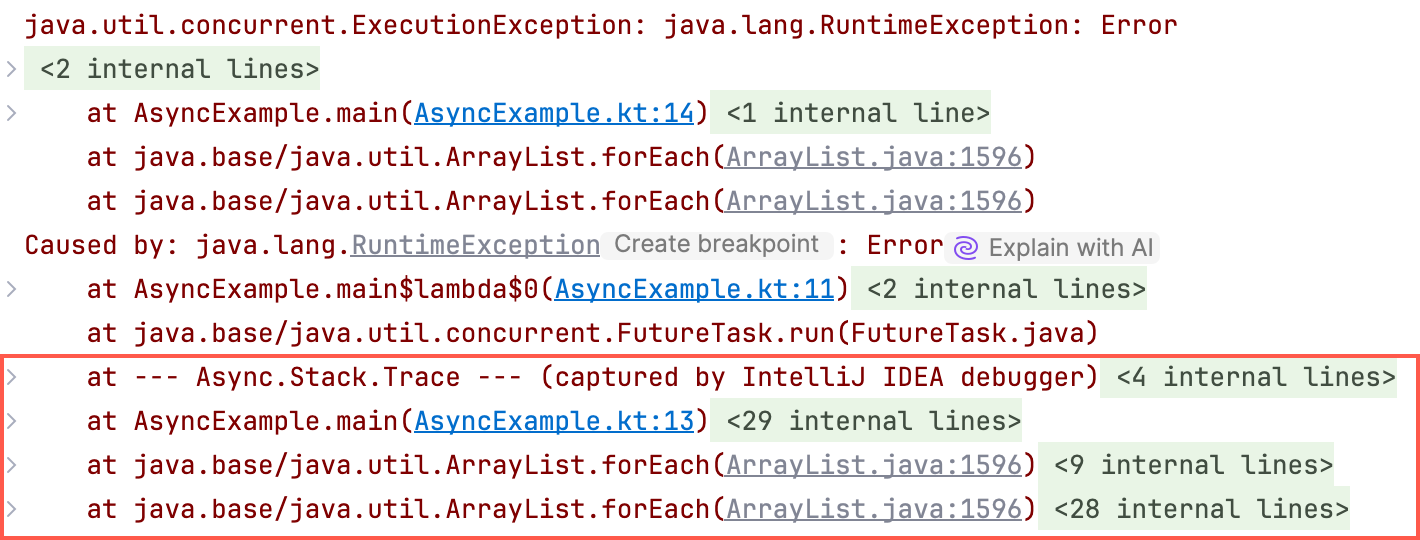
Async stack traces in the console
By default, async stack traces are shown in the console when you debug code or run JUnit/TestNG unit tests.

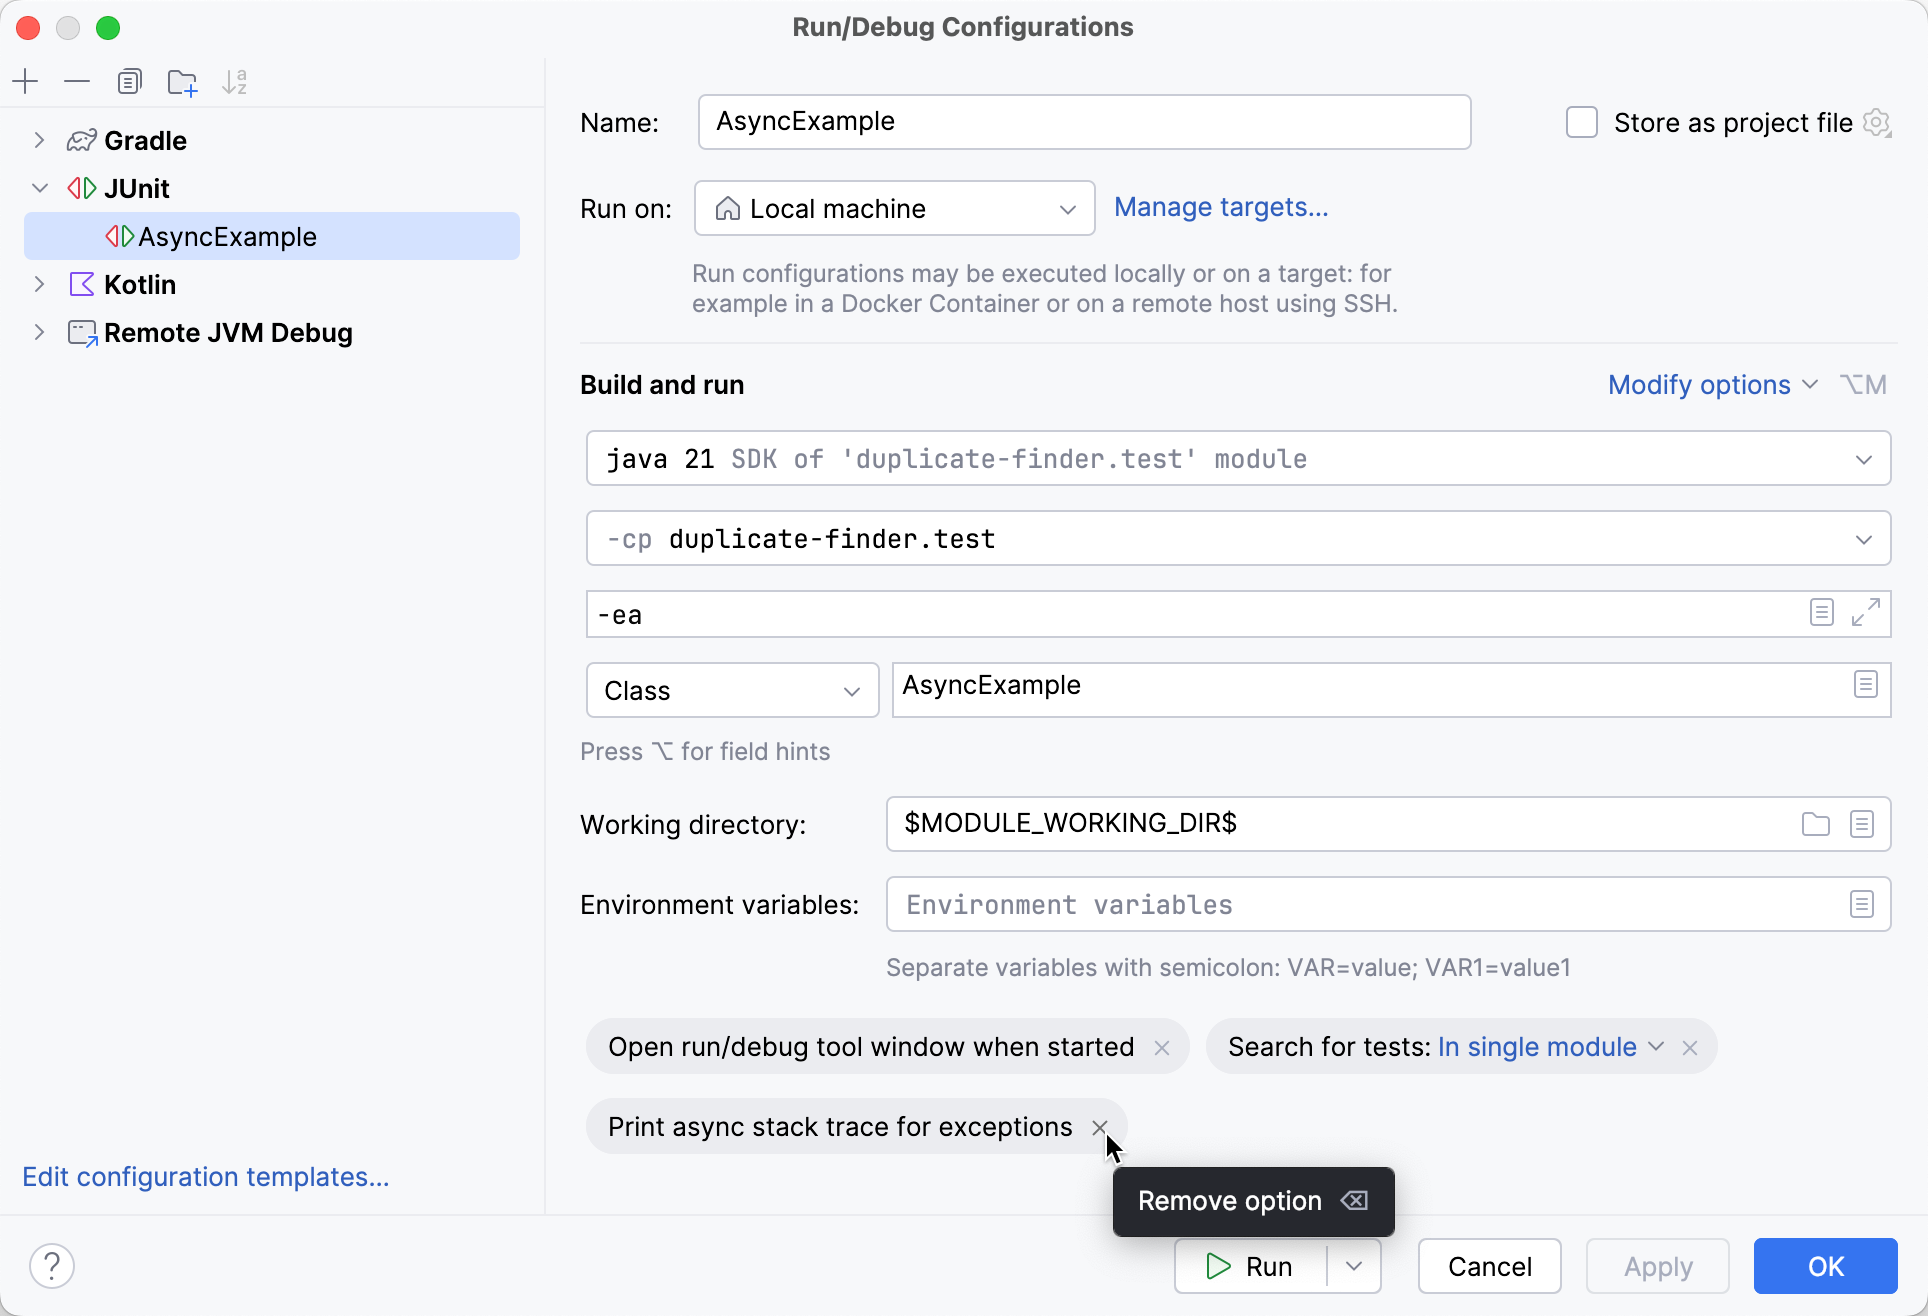
You can disable async stack traces for tests by clearing the Print async stack trace for exceptions checkbox in the corresponding run configuration.

For turning async stack traces on or off for debug sessions, use the Instrumenting agent option in the .
Async annotations
Async stack traces work out of the box with Swing and Java Concurrency API, but can also be manually extended to work with your own custom classes. This is done using special annotations.
Annotations are used to define capture and insertion points:
A capture point is a method where the stack trace is captured. At capture points, stack traces are stored and assigned a key. Capture points are marked with the
@Async.Scheduleannotation.An insertion point is a method where one of the previously stored stack traces is attached to the current stack. Insertion points are marked with the
@Async.Executeannotation.A key is a parameter or object reference that serves as a unique identifier for a captured stack trace. It is required for matching the parts of an async stack trace.
Define capture and insertion points
You can annotate either methods or their parameters:
If you want the object reference (
this) to be used as the key, annotate the method itself, for example:@Async.Schedule private static void schedule(Integer i) { System.out.println("Scheduling " + i); queue.put(i); }If you want the parameter value to be used as the key, annotate the method parameter, for example:
private static void schedule(@Async.Schedule Integer i) { System.out.println("Scheduling " + i); queue.put(i); }
To test how annotations work, you can use the following example:
Define custom annotations
If you don't want to add the JetBrains annotations dependency for your project, you can define your own annotations and use them instead of the default ones.
Create your own annotations for the capture point and the insertion point. For reference, see Async.java.
Press Ctrl+Alt+S to open settings and then select .
Click Configure annotations.
In the Async Annotations Configuration dialog, click
to add your custom annotations to Async Schedule annotations and Async Execute annotations.
Advanced configuration
Annotation-based approach relies on the instrumenting agent and works in most cases. There is a way to delegate all the work solely to the debugger. This may be required if you:
need to capture local variables
cannot use annotations
cannot use the instrumenting agent
Under the hood, this approach uses hidden breakpoints instead of annotations. When such a hidden breakpoint is reached, the specified expression is evaluated, and its result is then used to match the parts of the async stack trace.
There is a tradeoff between flexibility and performance. This option is not recommended for highly concurrent projects where performance is critical.
Press Ctrl+Alt+S to open settings and then select .
Click
and provide the following information:
Capture class name: fully-qualified name of the class where stack traces should be captured, for example,
javax.swing.SwingUtilitiesCapture method name: method name without parameter list and parentheses, for example,
invokeLaterCapture key expression: the expression whose result will be used as the key. In expressions, you can use everything that is reachable in the context of the frame. Method parameters can be specified as
param_N, whereNis the zero-based number of the parameter, for example,param_0.Insert class name: fully-qualified name of the class where stack traces should be matched, for example,
java.awt.event.InvocationEventInsert method name: method name without parameter list and parentheses, for example,
dispatchInsert key expression: the expression whose result will be used as the key. In expressions, you can use everything that is reachable in the context of the frame. Method parameters can be specified as
param_N, whereNis the zero-based number of the parameter, for example,param_0.
(Optional) If you also want to capture local variables (primitives and String values together with the call stack, select the Capture local variables option. Note that this may slow down the debugging process.
You can download additional capture settings from the following repository: IntelliJ IDEA debugger Capture Points
View async stack traces in remote JVMs
If you are debugging a remote process, for example, managed within a Docker container, you can still use the JVM Instrumenting Agent to display Async Stack Traces as if it were started from the IDE.
To use the agent remotely, do the following:
copy <IDEA installation folder>/lib/rt/debugger-agent.jar to any location on the remote machine
add
-javaagent:<path to debugger-agent.jar>to the remote JVM options