Breakpoints
Breakpoints are special markers that suspend program execution at a specific point. This lets you examine the program state and behavior. Breakpoints can be simple (for example, suspending the program on reaching some line of code) or involve more complex logic (checking against additional conditions, writing log messages, and so on).
Once set, a breakpoint remains in your project until you remove it explicitly, except for temporary breakpoints.
note
If a file with breakpoints was modified externally, for example, updated through a VCS or changed in an external editor, and the line numbers have changed, breakpoints will be moved accordingly. Note that PhpStorm must be running when such changes are made, otherwise they will pass unnoticed.
The following types of breakpoints are available in PhpStorm:
Line breakpoints: suspend the program upon reaching the line of code where the breakpoint was set. This type of breakpoints can be set on any executable line of code.
Method breakpoints: suspend the program upon entering or exiting the specified method or one of its implementations, allowing you to check the method's entry/exit conditions.
Exception breakpoints: suspend the program when
Exceptionor its subclasses are thrown. They apply globally to the exception condition and do not require a particular source code reference.
Click the gutter at the executable line of code where you want to set the breakpoint. Alternatively, place the caret at the line and press CtrlF8.

Click the gutter at the line where the method is declared. Alternatively, place the caret at the line and press CtrlF8.

Alternatively, do the following:
Press CtrlShiftF8 or select Run | View Breakpoints from the main menu.
In the Breakpoints dialog that opens, press AltInsert or click
, and select PHP Method Breakpoints.
In the Add Method Breakpoint dialog, specify the class and the method, or the plain function to add a breakpoint for.
Press CtrlShiftF8 or select Run | View Breakpoints from the main menu.
In the Breakpoints dialog, press AltInsert or click
, and select PHP Exception Breakpoints or JavaScript Exception Breakpoint.
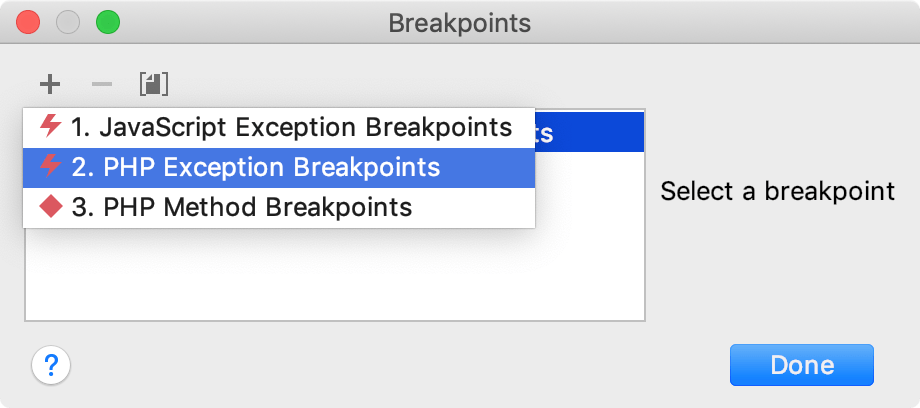
In the Add Exception Breakpoint dialog, specify the exception class.
For more information, refer to Debug with PHP exception breakpoints.
When using Xdebug (2.8 and later), PhpStorm employs its breakpoints resolving mechanism. Under this mechanism, the debugger evaluates whether PHP can generate internal executable bytecode for the current line. If there is no such code on the line that the breakpoint refers to, the corresponding breakpoint cannot be hit. Xdebug will scan up to 5 subsequent lines, stop at the line where executable code is located, and update the breakpoint definition to this line.
In the following example, the breakpoint is placed on line 4, which doesn't contain any executable code:

When you run a debugging session, PhpStorm moves the breakpoint to line 5 where it is resolved, suspends the session, and displays a corresponding notification.
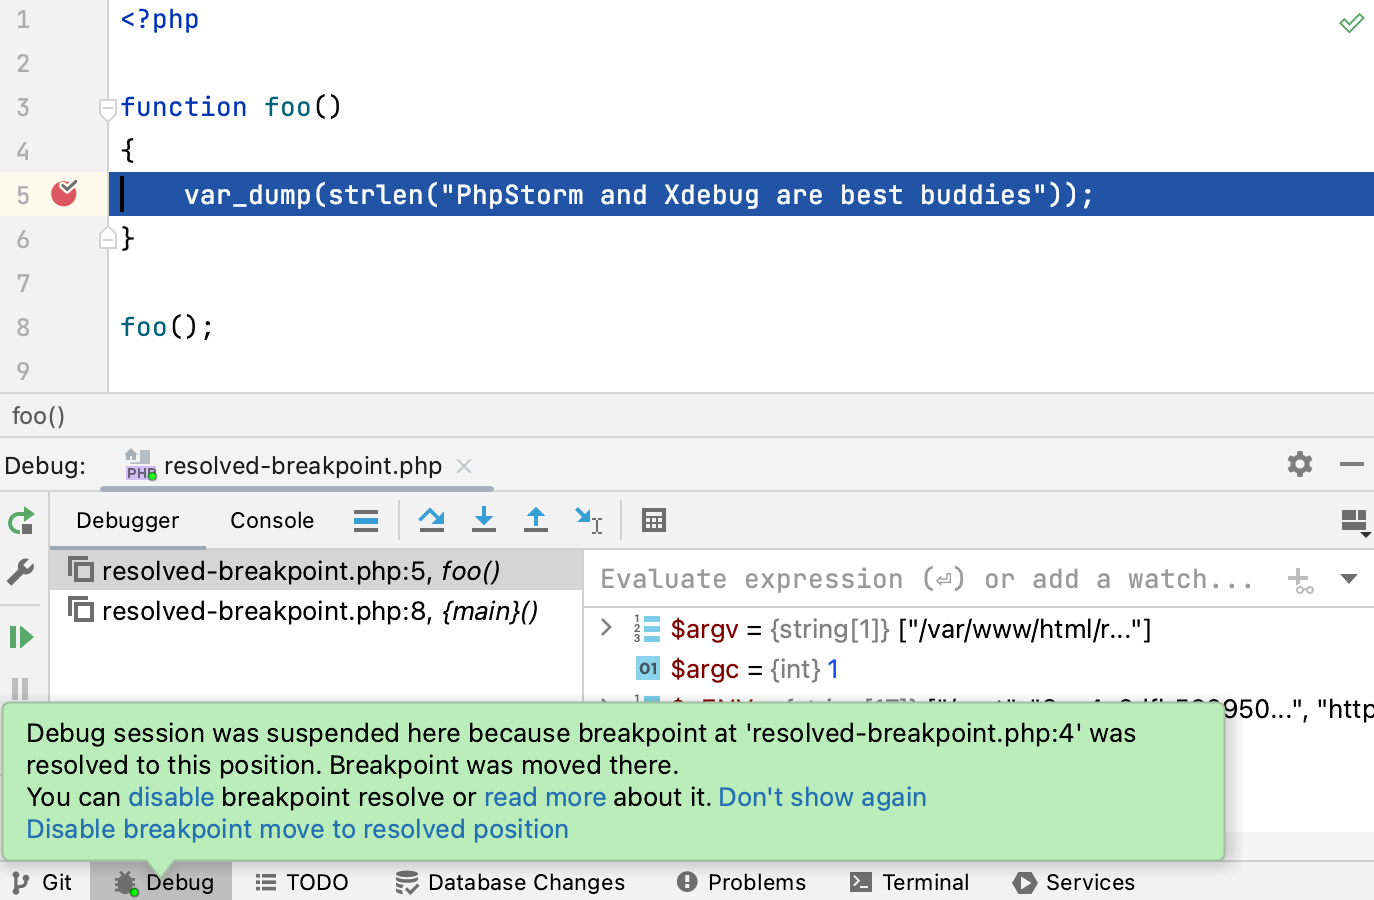
If you don't want PhpStorm to resolve and move breakpoints during debugging sessions, you can disable this feature on the PHP | Debug page of the Settings dialog (CtrlAlt0S) .
In the Xdebug area:
Unselect the Resolve breakpoint if it's not available on the current line (Xdebug 2.8+) checkbox to disable the entire breakpoint resolving feature. Note that if resolving is disabled, the breakpoints set on the code lines without executable code will always be ignored.
Unselect the Move breakpoint to resolved position if it's different from the source checkbox to disable only automated adjustment of the breakpoint position to the line where Xdebug actually stops after resolving the breakpoint. Note that the breakpoint resolving feature will still be enabled.
In the Settings area, unselect the Notify if breakpoint was resolved to a different line (Xdebug 2.8+) checkbox to turn off PhpStorm notifications every time when a breakpoint is resolved.
tip
To get an in-depth technical overview of how breakpoints resolving works, refer to this article and DBGP documentation.
With Xdebug 3.2 and later, PhpStorm supports Xdebug's return value debugging feature. This is an extra debugging step for inspection of return values in functions that return them immediately without storing in intermediate variables.
To run Xdebug return value debugging in PhpStorm:
Set a line breakpoint at the return statement line.
Launch the PHP debugging session. The debugger will suspend execution at the last statement in the function.
Click Step Into on the Debug toolbar (F7).
The additional variable is now available for inspection in the Variables tab of the Debug tool window in a watch.
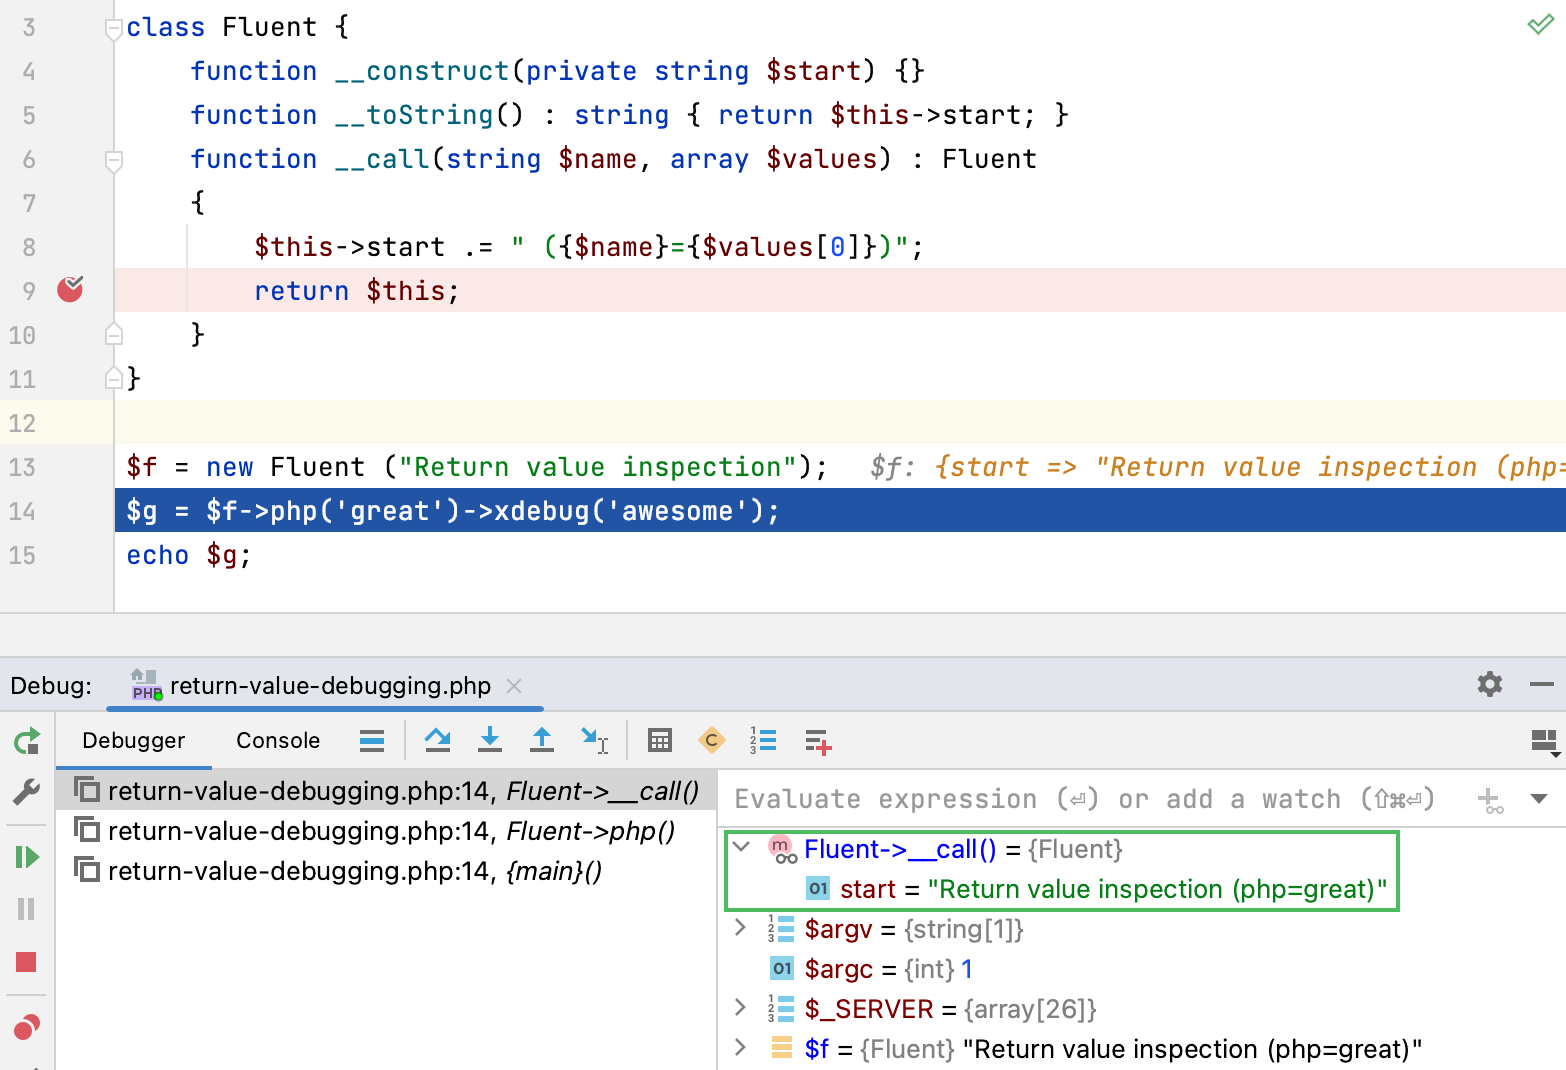
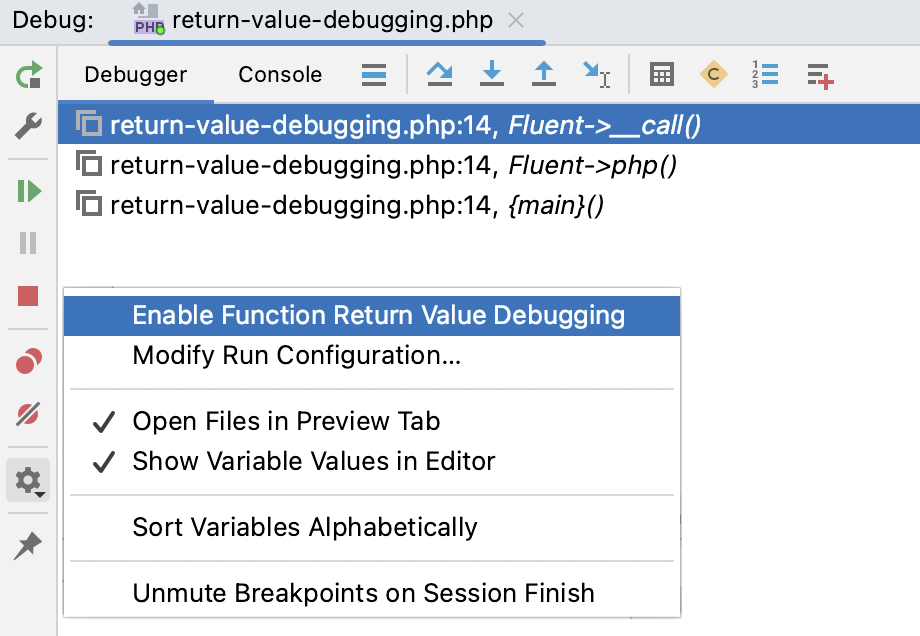
Return value debugging is enabled in PhpStorm by default. To disable it, do either of the following:
In the Debug tool window, open the Settings menu and unselect the Enable Function Return Value Debugging option.
On the PHP | Debug page of the Settings dialog (CtrlAlt0S) , unselect the Enable return function value debugging (Xdebug 3.2+) checkbox in the Xdebug area.
For non-exception breakpoints: click the breakpoint in the gutter.
For all breakpoints: go to Run | View Breakpoints CtrlShiftF8 in the main menu, select the breakpoint, and click Remove Delete.
To avoid accidentally removing a breakpoint and losing its parameters, you can choose to remove breakpoints by dragging them to the editor or clicking the middle mouse button. To do this, go to Settings | Build, Execution, Deployment | Debugger and select Drag to the editor or click with middle mouse button. Clicking a breakpoint will then enable or disable it.
If you don't need to stop at your breakpoints for some time, you can mute them. This allows you to resume normal program operation without leaving the debugger session. After that, you can unmute breakpoints and continue debugging.
Click the Mute Breakpoints button
in the toolbar of the Debug tool window.
When you remove a breakpoint, its internal configuration is lost. To temporarily turn an individual breakpoint off without losing its parameters, you can disable it:
For non-exception breakpoints: right-click it and set the Enabled option as required. You can also toggle them with the middle mouse button if removing breakpoints is not assigned to it.
For all breakpoints: click Run | View Breakpoints CtrlShiftF8 and check/uncheck the breakpoint on the list.
To move a breakpoint, drag it to another line.
To copy a breakpoint, hold Ctrl and drag a breakpoint to another line. This creates a breakpoint with the same parameters at the destination.
Depending on the breakpoint type, you can configure additional properties which allow you to tailor its operation for specific needs. The most used options are available via intentions.
To access breakpoint intentions, place the caret at the line with the breakpoint and press AltEnter. Use this option when you need to quickly configure basic breakpoint properties.
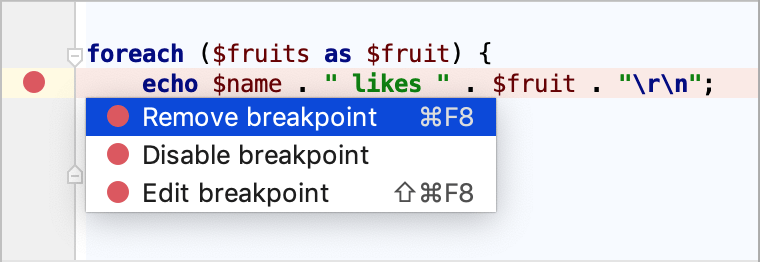
To access the full list of properties, right-click the breakpoint and click More or press CtrlShiftF8. Use this option for a bird's eye view of all breakpoints and full control over their configuration.
Intention | Description |
|---|---|
Remove breakpoint | Removes the breakpoint at the selected line. |
Disable Breakpoint | Disables the breakpoint at the selected line. |
Edit breakpoint | Opens a dialog with the most used breakpoint properties. For more properties, click More or press CtrlShiftF8. |
Clear the checkbox to temporarily disable a breakpoint without removing it from the project. Disabled breakpoints are skipped during stepping.
You can configure PhpStorm to enable/disable breakpoints on clicking rather than removing them altogether. To do this, go to Settings | Build, Execution, Deployment | Debugger and set the Remove breakpoint option to Drag to the editor or click with middle mouse button.
Specifies whether to pause the program execution when the breakpoint is hit.
Non-suspending breakpoints are useful when you need to log some expression without pausing the program (for example, when you need to know how many times a method was called) or if you need to create a master breakpoint that will enable dependent breakpoints when hit.
This option is used to specify a condition that is checked each time the breakpoint is hit. A condition is a PHP Boolean expression evaluating to true or false, for example $someID == 'foo'. If the condition evaluates to true, the selected actions are performed. Otherwise, the breakpoint is ignored.
note
The condition must be valid at the line where the breakpoint is set.
The result of the expression is taken from the return statement. When there is no return statement, the result is taken from the last line of code.
When evaluating expressions, make sure you are aware of their possible side effects as they may potentially affect the behavior and the result of the program.
When a breakpoint is hit, the following can be logged to the console:
"Breakpoint hit" message: a log message like
Breakpoint reached: LineBreakpoint.php:10.Stack trace: the stack trace for the current frame. This is useful if you want to check what paths have led to this point without interrupting the program execution.
Evaluate and log: the result of an arbitrary expression, for example,
'Initializing'orusers->size ().The result of the expression is taken from the return statement. When there is no return statement, the result is taken from the last line of code which doesn't even have to be an expression: a literal works too. This can be used to produce a custom message or to keep track of some values as the program executes.
When evaluating expressions, make sure you are aware of their possible side effects as they may potentially affect the behavior and the result of the program.
When a breakpoint is selected in the Disable until hitting the following breakpoint box, it acts as a trigger for the current breakpoint. This disables the current breakpoint until the specified breakpoint has been hit.
You can also choose whether to disable it again after this has happened or leave it enabled.
This option is useful when you only need to suspend the program under certain conditions or after certain actions. In this case, the trigger breakpoint usually isn't required to stop the program execution and is made non-suspending.
Breakpoints can have the following statuses:
Status | Description |
|---|---|
Verified | After you have started a debugger session, the debugger checks whether it is technically possible to suspend the program at the breakpoint. If yes, the debugger marks the breakpoint as verified. |
Warning | If it is technically possible to suspend the program at the breakpoint, however there are issues related to it, the debugger gives you a warning. This may happen, for example, when it is impossible to suspend the program at one of the method's implementations. |
Invalid | If it is technically impossible to suspend the program at the breakpoint, the debugger marks it as invalid. The most common cause for this is that there is no executable code on the line. |
Inactive/dependent | A breakpoint is marked as inactive/dependent when it is configured to be disabled until another breakpoint is hit, and this has not happened yet. |
Muted | All breakpoints are temporarily inactive because they have been muted. |
Disabled | This breakpoint is temporarily inactive because it has been disabled. |
Non-suspending | The suspend policy is set for this breakpoint so that it does not suspend the execution when hit. |
Depending on their type and status, breakpoints are marked with the following icons:
Line | Method | Exception | ||
|---|---|---|---|---|
Regular | ||||
Disabled | ||||
Verified | ||||
Muted | ||||
Inactive/dependent | ||||
Muted disabled | ||||
Non-suspending | ||||
Verified non-suspending | ||||
Invalid | ||||
- Use breakpoints for debug printing
Use non-suspending logging breakpoints (sometimes referred to as watchpoints in other debuggers) instead of inserting print statements in your code. This provides a more flexible and centralized way of handling debug log messages.
- Set logging breakpoints more quickly
To set a non-suspending logging breakpoint, hold Shift and click the gutter. This will not suspend the program execution and instead log a message like
Breakpoint reached: LineBreakpoint.php:10. If you want to log some expression that is in front of you in the editor, select it before holding Shift and clicking the gutter.- Add breakpoint descriptions
If you have many breakpoints in your project, you can add descriptions to breakpoints for ease of search. To do this, right-click a breakpoint in the Breakpoints dialog CtrlShiftF8 and select Edit description from the menu. Now when you start typing the breakpoint name, it gets the focus.
Thanks for your feedback!