Troubleshooting common PHP debugging issues
This section provides the list of solutions and workarounds for common problems with Debugging in PhpStorm.
If your issue is not addressed in this section, contact our support engineers. If asked to provide deployment logs, follow the instructions to collect them.
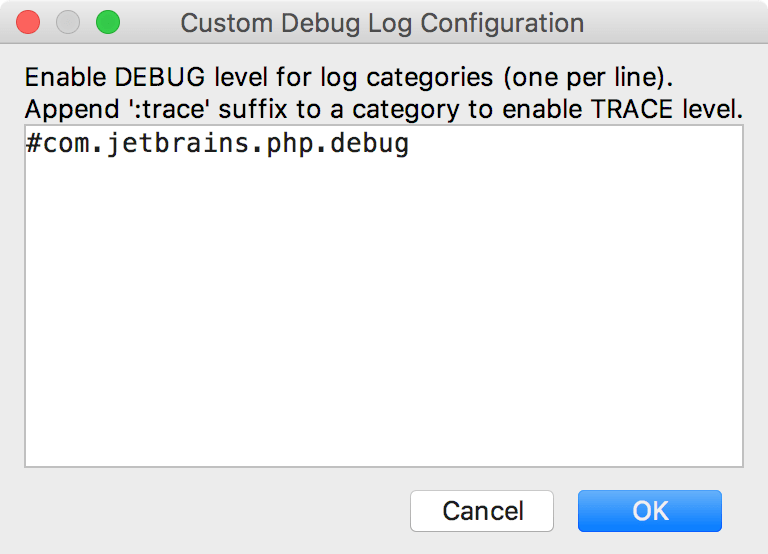
Select Help | Diagnostic Tools | Debug Log Settings in the main menu.
In the Custom Debug Log Configuration dialog that opens, add the following lines depending on the issues you are experiencing:
Issues with PHP debugging:
#com.jetbrains.php.debug

Click OK and reproduce the issue.
Locate the log file by selecting Help | Show Log in Explorer (for Windows and Linux) or Help | Show Log in Finder (for macOS).
If necessary, you can locate the log manually:
WindowsmacOSLinuxThe most recent log file is named idea.log; older files names end with a number, that is idea.log.1, idea.log.2, and so on. In most cases you need only the most recent one.
Attach the log file(s) to the issue or forum thread.
When using Xdebug, it is possible to make it log its actions.
In the Settings dialog () , go to PHP.
From the PHP executable list, choose the relevant PHP interpreter and click
next to it. In the CLI Interpreters dialog that opens, click the Open in Editor link next to the Configuration file: <path to php.ini> file. Close all the dialogs and switch to the tab where the php.ini file is opened.
In the php.ini, enable Xdebug logging by adding the following line:
Xdebug 3Xdebug 2xdebug.log="path_to_log/xdebug.log"xdebug.remote_log="path_to_log/xdebug.log"The log file contains the raw communication between PhpStorm and Xdebug as well as any warnings or errors:
Log opened at 2018-01-08 08:14:28 I: Connecting to configured address/port: 127.0.0.1:9000. I:
Connected to client. :-) -> <init xmlns="urn:debugger_protocol_v1"
xmlns:xdebug="https://xdebug.org/dbgp/xdebug"
fileuri="file:///C:/Projects/Samples/DebuggingTutorial/debugging.php" language="PHP"
protocol_version="1.0" appid="3040" idekey="11774"><engine version="2.2.5"><![CDATA[Xdebug]]></engine><author><![CDATA[Derick
Rethans]]></author><url><![CDATA[https://xdebug.org]]></url><copyright><![CDATA[Copyright
(c) 2002-2018 by Derick Rethans]]></copyright></init>

<- step_into -i 5 -> <response xmlns="urn:debugger_protocol_v1"
xmlns:xdebug="https://xdebug.org/dbgp/xdebug" command="step_into" transaction_id="5" status="break"
reason="ok">< xdebug:message
filename="file:///C:/Projects/Samples/DebuggingTutorial/debugging.php" lineno="2"></xdebug:message></response>
note
The log file will not automatically roll over or be truncated and may grow to a vast file size. When logging is no longer needed, it is recommended that you disable it.
To debug PHP code with PhpStorm, make sure that you have a debugging engine, either Xdebug or Zend Debugger, installed and configured properly.
These tools cannot be used simultaneously because they block each other. To avoid this problem, you need to update the corresponding sections in the php.ini file as described in Configure Xdebug and Configure Zend Debugger.
To validate the debugging engine configuration, perform the steps described in Validate the configuration of a debugging engine
When running PHP, it can happen that a startup warning or error is displayed. When this is the case, the debugger may fail to work. PhpStorm will also not be able to recognize the debugger being used.
To verify that no startup warnings or errors are displayed, run the following command:
php --versionThis will return a message similar to the following:
<some error/warning> PHP 7.1.20 (cli) (built: Jul 20 2018 10:27:12) ( NTS ) Copyright (c) 1997-2018
The PHP Group Zend Engine v3.1.0, Copyright (c) 1998-2018 Zend Technologies with Zend OPcache v7.1.20,
Copyright (c) 1999-2018, by Zend Technologies with Xdebug v2.6.0, Copyright (c) 2002-2018, by Derick Rethans
If any errors or warnings are present on the first lines, it's recommended to fix them before continuing.
When the debugger cannot connect or refuses the connection, check the following:
Make sure Xdebug or Zend Debugger are configured to connect to the host and port PhpStorm is running on.
In the Xdebug configuration, make sure
xdebug.remote_hostandxdebug.remote_port(xdebug.client_hostandxdebug.client_portfor Xdebug 3) are correct. For more information, refer to the Xdebug documentation.When using Zend Debugger, make sure the generated PhpStorm bookmarklets or a Browser Debugging Extension is configured to use the correct IP address and port.
When using a remote PHP interpreter, verify the steps outlined in Remote debugging via SSH tunnel.
In the Settings dialog () , navigate to PHP | Debug and make sure PhpStorm and Xdebug / Zend Debugger are configured with the same port numbers.
In PhpStorm, enable listening to incoming debug connections by either clicking
(
in the classic UI) on the toolbar/the status bar or selecting Run | Start Listening for PHP Debug Connections in the main menu. This will ensure PhpStorm reacts when a debugging session is started and opens the Debug tool window automatically. Before launching the script, make sure that either a breakpoint is set or the Break at first line in PHP scripts option is enabled on the Debug page of the Settings dialog .
Verify no firewall, router or ISP is blocking the connection. This can be verified by running
telnet host 9000 (for Xdebug)ortelnet host 10137(for Zend Debugger) from remote server (where host is an IP address of your local machine running PhpStorm) and checking a connection is established. You can use http://www.canyouseeme.org or a similar service to check for opened inbound ports.Make sure that
xdebug.remote_host(for Xdebug 2),xdebug.client_host(for Xdebug 3), orzend_debugger .allow_hosts(for Zend Debugger) are properly configured. The value can be a host name (for example, localhost) or an IP address of the machine where PhpStorm is running, and it must be pingable from the server. When using Xdebug, xdebug.remote_connect_back (for Xdebug 2) or xdebug.discover_client_host (for Xdebug 3) can be used for troubleshooting.
If you initiate a Zero-configuration debugging session without having configured a Debug server, upon establishing connection PhpStorm displays the Incoming Connection dialog where suggests importing mappings from a server access configuration (deployment configuration). If you choose Import mappings from deployment, PhpStorm tries to detect the most suitable deployment configuration, preselects it in the Deployment list, and the Preview area shows the absolute path to the project file, which corresponds to the currently executed script according to the mappings from the selected configuration.
If PhpStorm does not detect a relevant configuration:
Choose the most suitable configuration from the list or click
and create a new configuration in the Deployment dialog that opens, whereupon the new configuration is added to the list.
In the Deployment root field, type the absolute path to the server root folder.
You can also select the Manually choose local file or project option, in this case PhpStorm displays the project tree view where you can select a project file and map the currently executed script to it. You can also select and map the entire project.
note
Path mappings cannot be set for project files or folders that are marked as excluded.
To continue debugging with the imported or manually specified configuration settings, click Accept.
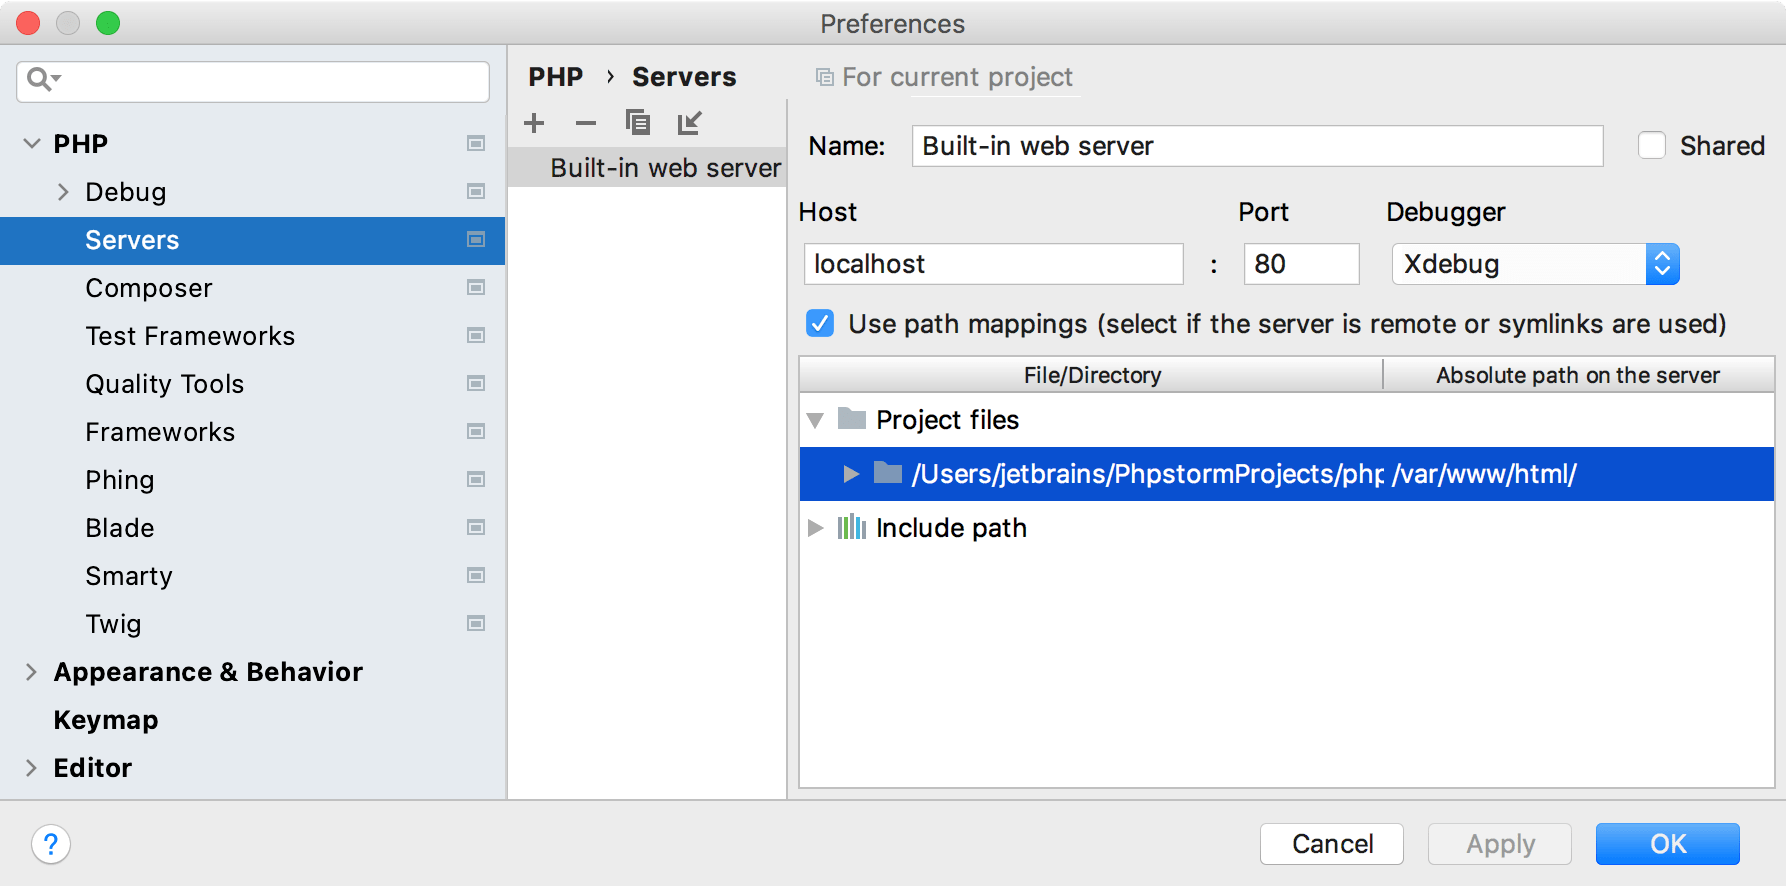
In some cases, the debugger can connect, but you get the error messages indicating that no mapping between the remote and project files is defined. This means that PhpStorm cannot determine which local file corresponds to the file being debugged.

To solve this problem, click Click to set up path mappings and providing the necessary path mappings.
Path mappings are used when the paths to the files processed by the server differ from the paths to the files in the PhpStorm project. This happens in the following cases:
The server is remote and the project files are local copies of the originals.
The files processed by the server and the files opened in the IDE are the same, but symlinks are used. Because the debugger resolves symlinks during a debugging session, you need to tell the IDE actual solute physical paths to the files on the server.
To configure path mappings, in the Settings dialog () , navigate to PHP | Servers.

If the files that the server processes are in the project and you are not using symlinks, clear the Use path mappings checkbox. In this case, the IDE will open files according to the paths received from the debugger.
A path mapping specified for a parent directory is automatically applied to all its subdirectories. If necessary, path mappings for any subdirectory or file can be specified.
See Configure synchronization with a server for more details.
note
Path mappings cannot be set for project files or folders that are marked as excluded.
When breakpoints are not being hit, but the debugger seems to connect, verify the following:
Verify the breakpoint is not disabled. Using the Run | View Breakpoints menu command , check that breakpoints are enabled. Select the checkbox next to a breakpoint to enable it.
Make sure that path mappings are correct.
On macOS, when a file or folder is renamed using Finder, and the letter case is changed, PhpStorm may not be able to find the files. If renaming is required, make sure to do it in the IDE or using a terminal and the
mvcommand. Renaming project files or folders using Finder may result in strange behaviour. See here for more details.There are some rare cases when breakpoints can't be hit due to technical limitations, for example, caused by the way how PHP generates bytecode. See here for more details.
When using Xdebug, you can use the xdebug_break() function to force a breakpoint from within PHP. When Xdebug encounters this function during execution, it will pause at the next statement in the IDE even if no breakpoint was defined there originally.
This can happen due to the Xdebug's internal breakpoints resolving mechanism. Under this mechanism, the debugger evaluates whether PHP can generate internal executable bytecode for the current line. If there is no such code on the line that the breakpoint refers to, the corresponding breakpoint cannot be hit. Xdebug will scan up to 5 subsequent lines, stop at the line where executable code is located, and update the breakpoint definition to this line.
If you don't want PhpStorm to resolve and move breakpoints during debugging sessions, you can disable this feature on the PHP | Debug page of the Settings dialog () .
In the Xdebug area:
Unselect the Resolve breakpoint if it's not available on the current line (Xdebug 2.8+) checkbox to disable the entire breakpoint resolving feature. Note that if resolving is disabled, the breakpoints set on the code lines without executable code will always be ignored.
Unselect the Move breakpoint to resolved position if it's different from the source checkbox to disable only automated adjustment of the breakpoint position to the line where Xdebug actually stops after resolving the breakpoint. Note that the breakpoint resolving feature will still be enabled.
In the Settings area, unselect the Notify if breakpoint was resolved to a different line (Xdebug 2.8+) checkbox to turn off PhpStorm notifications every time when a breakpoint is resolved.
tip
To get an in-depth technical overview of how breakpoints resolving works, refer to this article and DBGP documentation.
Establishing a Zero-Configuration debugging session may fail with no breakpoints hit and therefore the script not suspended. This may happen if the path mappings are not configured or configured erroneously, or if you have not set any breakpoints. In the latter case, you can do any of the following:
Set a breakpoint by clicking the gutter at the desired executable line of code. For more information, refer to Breakpoints.
In the Settings dialog () , go to PHP | Debug and in the External Connections area, select the Break at first line in PHP scripts checkbox.
Enable the Run | Break at first line in PHP scripts option from the main menu.
To have PhpStorm display a notification if the script is not suspended, select the Notify if debug session was finished without being paused checkbox in the Advanced Settings area on the PHP | Debug page of the Settings dialog.
When using the nginx web server, debugging may fail if the $_SERVER["SERVER_NAME"] is not provided by PHP. To solve this, add a fastcgi parameter to the nginx configuration:
fastcgi_param SERVER_NAME $server_name;or
fastcgi_param SERVER_NAME $host;For more information, refer to the nginx documentation and this community post.
If you see the following messages in Xdebug log:
Log opened at 2017-02-21 17:52:27
        I: Connecting to configured address/port: 172.19.0.1:9000.
        W: Creating socket for '172.19.0.1:9000', poll success, but error: Operation now in progress (29).
        E: Could not connect to client. :disappointed:
        Log closed at 2017-02-21 17:52:27
or
Log opened at 2017-02-22 13:17:13
        I: Connecting to configured address/port: 10.10.10.10:9000.
        E: Time-out connecting to client. :-(
        Log closed at 2017-02-22 13:17:14
This means that Xdebug tries to connect to the host and can't make the connection. To fix the issue, set xdebug.remote_connect_back=0 (xdebug.discover_client_host=false for Xdebug 3) and make sure that xdebug.remote_host (xdebug.client_host for Xdebug 3) is set correctly.
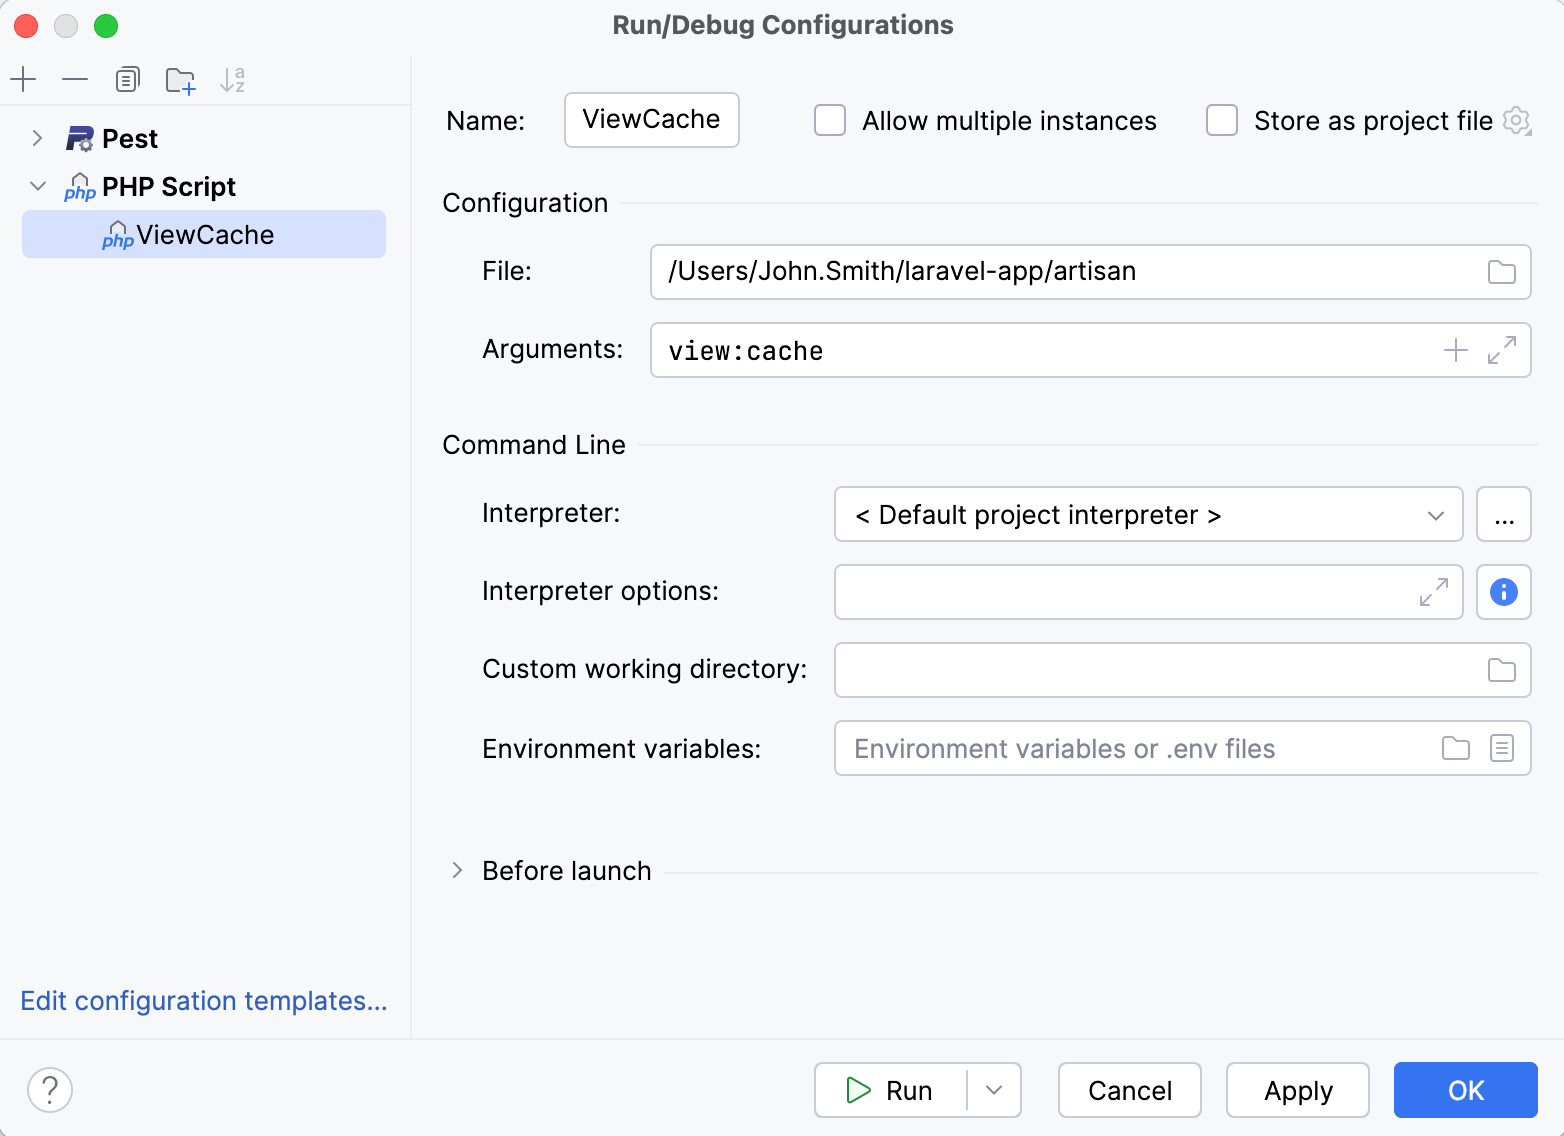
When trying to debug a CLI command of a PHP framework command-line tool, such as Symfony Console or Laravel Artisan, debugging fails with a PHP error Fatal error: Class '...\Command' not found" or similar.
The common cause for such errors is attempting to debug the file or class with the command directly. Instead, you should use a PHP Script, in which you provide the path to the command-line tool and the actual command to run. In this case, the framework commands bootstrapping logic will apply, and debugging will proceed normally.

For more information, refer to the following framework-specific guides:
When using Zend Debugger on Linux, you may occasionally see the following error:
Zend Debugger: Cannot read a valid value of zend_debugger.httpd_uid or zend.httpd_uid, will not
        perform dropping of privileges
This error occurs when the debugger cannot determine the UID of the user running the web server process. Find the UID of that user and add it to php.ini:
zend_debugger.httpd_uid=1234After updating the setting, restart the web server.
In some PHP environments, ionCube is used to load and run the encoded PHP code. The ionCube loader extension does this by decoding the PHP code that is to be run and then making sure the PHP interpreter can execute it.
Officially, neither Xdebug nor Zend Debugger support running with ionCube enabled, however there are some workarounds to try. Note that these are not supported by JetBrains, ionCube, Xdebug or Zend Debugger.
Make sure the ionCube loader module is loaded first
In php.ini, verify the ionCube loader is loaded before any debugger extension is loaded, for example:
zend_extension=/usr/local/lib/php/extensions/no-debug-non-zts-20100525/ioncube_loader_lin_5.4.so
zend_extension=/usr/local/lib/php/extensions/no-debug-non-zts-20100525/xdebug.so
Use ionCube on-demand loading
We can disable the ionCube extension in php.ini and make use of ionCube's on-demand loading feature. When the first encoded PHP script is loaded, the PHP interpreter will check the configured
extension_dirto find the ionCube extension and run the encoded PHP script.Note that this method is not officially supported. It should only be used for debugging purposes and never on a production server.