Run/debug code
Quick way
If you are not going to pass any parameters to your program, and your program does not require any actions to be performed before start, you can run/debug it from the editor or the toolbar using a temporary configuration.
Run the current file
Open the file in the editor and use one of the following options to run it:
Right-click anywhere in the editor area to open the context menu and then select Run and <script name>
 from it.
On the toolbar above the editor, select the Current File option from the drop-down menu and click
 or
or  next to it.
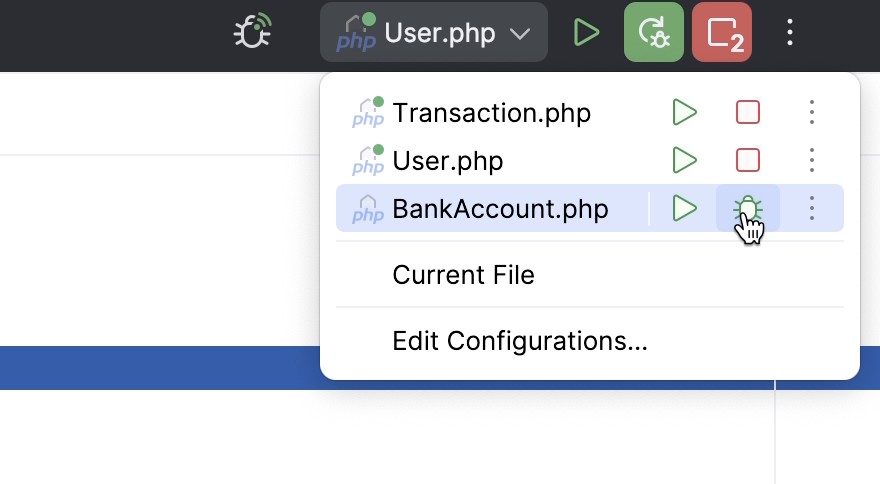
You can access other runners from the main toolbar as well: expand the list and select Current File. From the widget that opens, you can open the run configuration to specify more options.

When the application starts, you can view its output and interact with it in the Run tool window.

Open the current file in browser
PhpStorm comes with a built-in web server. If a local PHP interpreter is configured in the project, the built-in web server can be started to preview, run, and debug PHP scripts.
To render the PHP program output with a web browser, do one of the following:
Open the file in the editor and press Alt+F2.
Right-click the file in the Project tool window and select Open in Browser.
In the main menu, go to View | Open in Browser.
Use the browser popup in the top right part of the editor window (appears on hover). Click the browser button to open the web server file URL, or Shift+Click it to open the local file URL.

Customizable way
If you are going to pass parameters to your program or otherwise customize the startup of your program, or just want to make the program run reusable, use a run/debug configuration.
Edit and save a temporary configuration, or create a new run/debug configuration from a template and use one of the following options to run it:
If the run configuration is already selected in the Run widget, click
 next to it or press Shift+F10.
If you want to select another run configuration, click the Run widget. In the menu that opens, click
next to the run configuration you want to launch.
Press Alt+Shift+F10 and select the configuration on the pop-up window that opens.

Click Run from the Run/Debug Configurations dialog.

Re-run applications
On the toolbar of the Run tool window, click
 or press Shift+F10.
Run multiple debug configurations
To debug multiple tasks simultaneously, open the run widget menu in the toolbar and select the corresponding run/debug configurations while holding down the Ctrl key.
For launching multiple tasks using a single run/debug configuration, refer to Run/debug multiple targets.
Stop and pause applications
When you stop a program, its process is interrupted and exits immediately. When you pause a program, it continues running in the background, but its output is suspended.
Stop a program
In the Run tool window, click
 on the toolbar. Alternatively, press Ctrl+F2 and select the process to stop.
Pause the program output
Right-click in the Run tool window and select Pause Output from the context menu. Use the same toggle to resume the program.
Show running processes
You can view the list of all active run or debug sessions and navigate between them.
Go to Run | Show Running List. In the top-right corner of the editor, PhpStorm shows a list with all active applications.