Methods and Subsystems

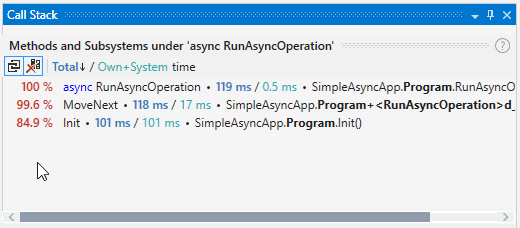
![]() The percentage of call execution time (total or own depending on the selected sorting) relative to the total selected time. If Follow selection in Call Tree is enabled, then relative to the total time of the call subtree selected in Call Tree.
The percentage of call execution time (total or own depending on the selected sorting) relative to the total selected time. If Follow selection in Call Tree is enabled, then relative to the total time of the call subtree selected in Call Tree.
![]() Short method name.
Short method name.
![]() Total / Own + System or Total / Own call execution time. See the details on how this time is calculated below.
Total / Own + System or Total / Own call execution time. See the details on how this time is calculated below.
![]() Full method name.
Full method name.
How call time is calculated
If ![]() Hide system functions is enabled, Total call time is calculated as a sum of method's own time and time of all child calls.
Hide system functions is enabled, Total call time is calculated as a sum of method's own time and time of all child calls.
If ![]() Hide system functions is disabled, system methods are shown in the list separately. In this case, method's Own time does not include the time of child system calls.
Hide system functions is disabled, system methods are shown in the list separately. In this case, method's Own time does not include the time of child system calls.

If ![]() Hide system functions is enabled, Methods and Subsystems calculates time (Total / Own + System) as follows:
Hide system functions is enabled, Methods and Subsystems calculates time (Total / Own + System) as follows:

If ![]() Hide system functions is disabled, Methods and Subsystems calculates time (Total / Own) as follows:
Hide system functions is disabled, Methods and Subsystems calculates time (Total / Own) as follows:

Viewing method's backtraces
To quickly view backtraces of a particular method
Hover the mouse over the method.
Click the arrow symbol
 on the left.