R plugin support
With the R plugin installed in PyCharm, you can perform various statistical computing using R language and use coding assistance, visual debugging, smart running and preview tools, and other popular IDE features. PyCharm supports R 3.4 and later.
With the R plugin, you can also get native support for .R files. Such files are marked with the ![]() icon.
icon.
R plugin support in PyCharm includes:
Coding assistance:
Error and syntax highlighting.
Ability to create line comments Ctrl+/.
Intention actions and quick fixes, including quick fixes for the missing import statements.
Auto-saving changes that you make in your files. Saving is triggered by various events, for example, closing a file or a project, or quitting the IDE.
Ability to preview data in the graphic and tabular forms.
Ability to run and debug R scripts with live variables view.
Quick start with the R plugin in PyCharm
To start working the R files in PyCharm:
Get familiar with the user interface
When you edit and execute R files with the R plugin in PyCharm, you should notice the following changes in PyCharm user interface:
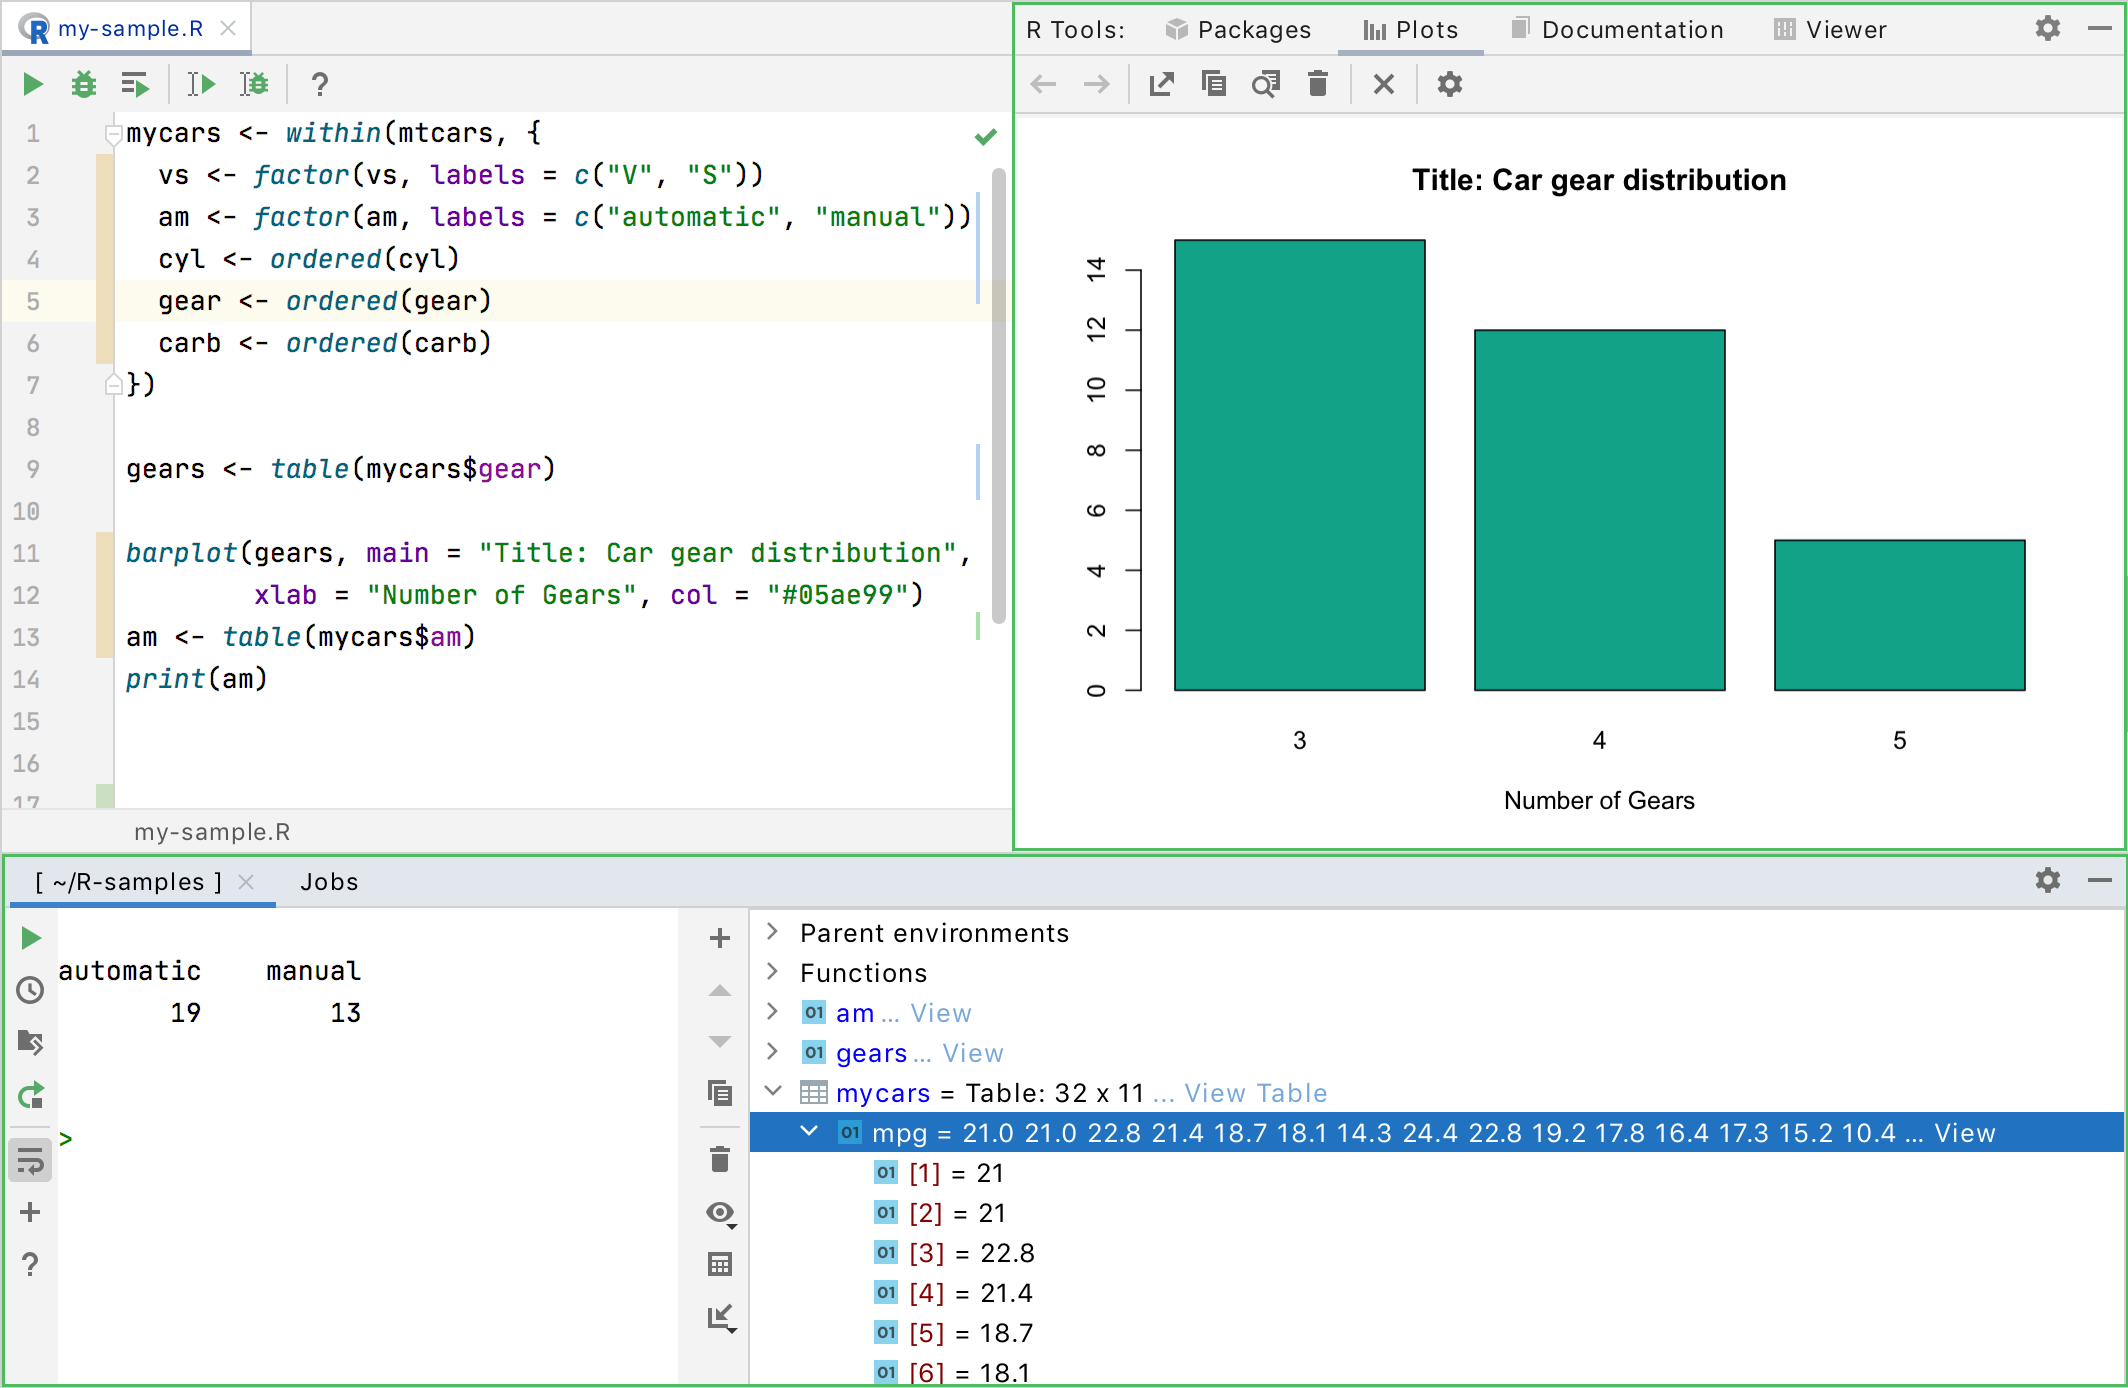
The R Tools window contains tabs to analyze plots, preview R documentation, and configure R packages. With the R Console, you can monitor R code execution as well as preview variable values.
At any time you can open R Tools and R Console windows by selecting the corresponding option in the View | Tool Windows menu.
R Console
The R Console tab appears in the group of the PyCharm tool windows. It enables executing R commands line by line similar to the console provided with the R installation.
Code completion (Ctrl+Space) is available as you type commands in the R Console. You can preview the values of the declared variables and the execution results in the Variables area.

| Item | Description |
|---|---|
| Execute the current statement in the one-line console (Enter). | |
| Open the R Console History to preview the list of the executed commands. | |
| Open any file in the editor, then click this button. The location of the opened file will be set as the current directory for the current console tab. | |
| Restart the console session. | |
| Softly wraps lines in the R Console. | |
| Open a new R Console tab. | |
| Help on executing R scripts. |
You can open several tabs in the R console for different tasks. To distinguish between the opened consoles, right-click any tab and enter a specific name.
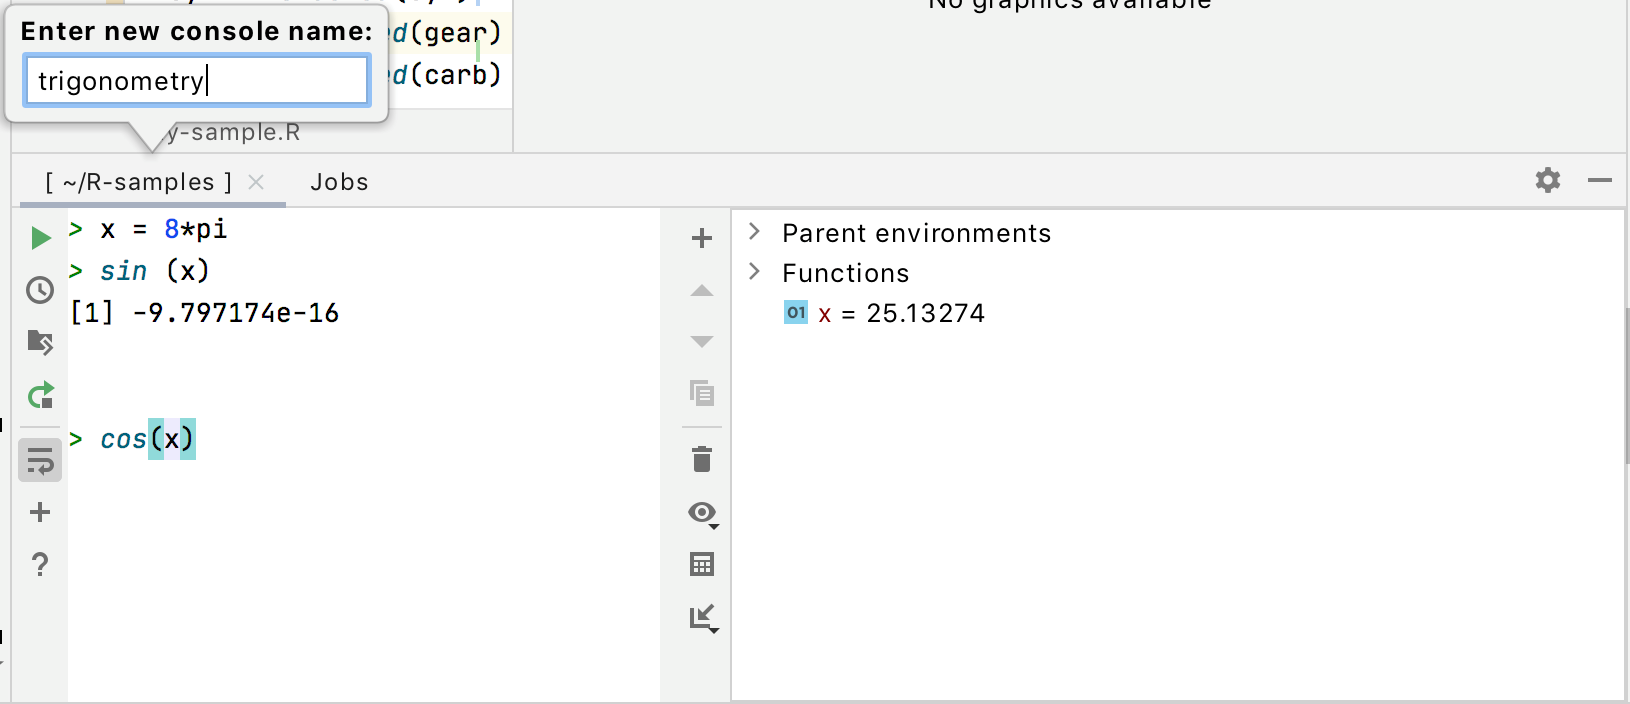
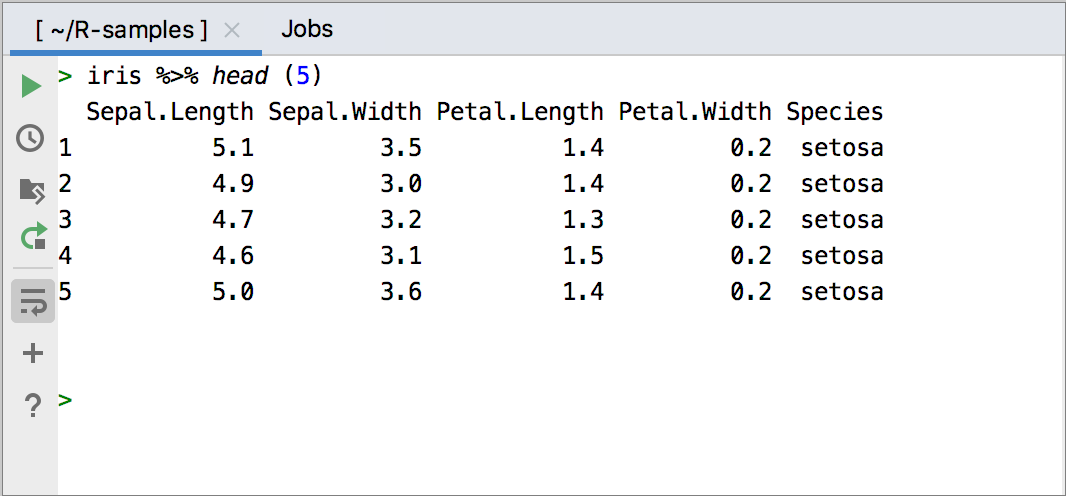
In the R console, you can use call the magrittr pipe function, %>%. Press the Ctrl + Shift + M (for Windows and Linux) or Command + Shift + M (for macOS) to insert it.
The Jobs tab shows the execution of the jobs initiated for R files. You can preview the job status (succeeded or failed), duration of the execution, and the time you launched the job.

Use the following icons of the Jobs toolbar:
| Item | Description |
|---|---|
| Add a new job. | |
| Clear the list of jobs. | |
| Rerun the job. |
Plots
In the Plots tab of the R Tools window, you can preview various graphs built with the R-specific data plotting libraries. The window displays all the graphs built within a single execution session that lasts until you close the R Console or explicitly terminate the process. The graphs are arranged one on a page.
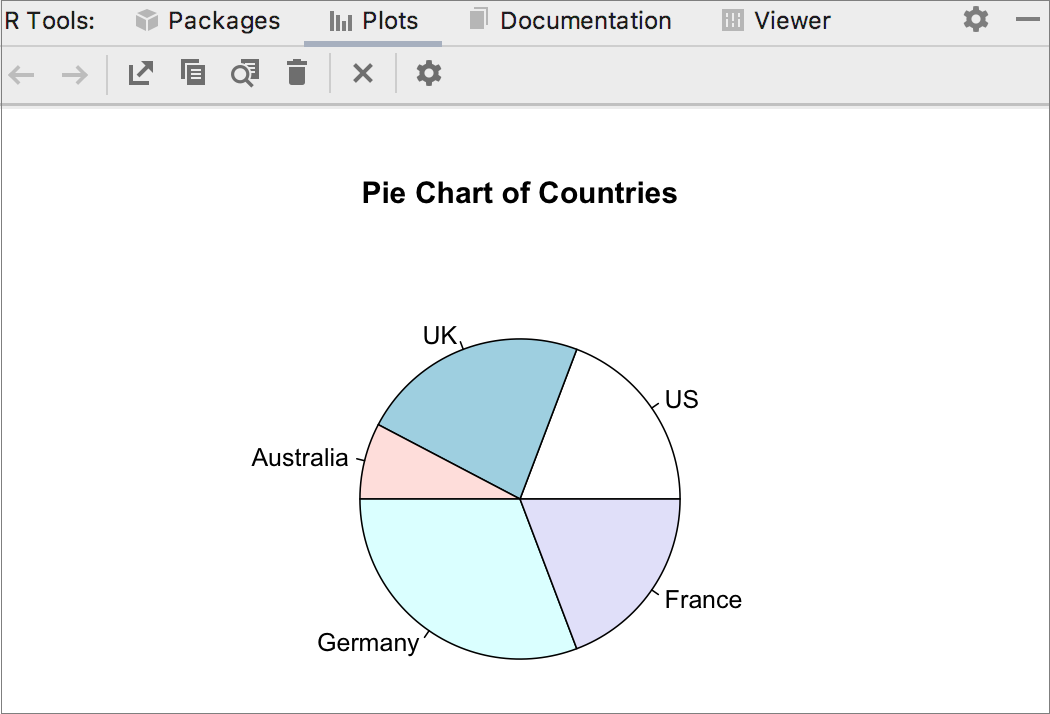
| Item | Description |
|---|---|
| Go to the previous or next graphics page. | |
| Save the graphics in a .png file. | |
| Copy the graphics in the clipboard. | |
| Zoom in the graphics. | |
| Close the currently selected page. | |
| Close all graphics pages. | |
| Open the Graphics device settings dialog to set up the size of the image and its resolution. |
Tables
When you analyze tabular data in the Variables view, you can click the View Table link and preview the table in a separate tab the editor. To order values in a particular column, click its header.
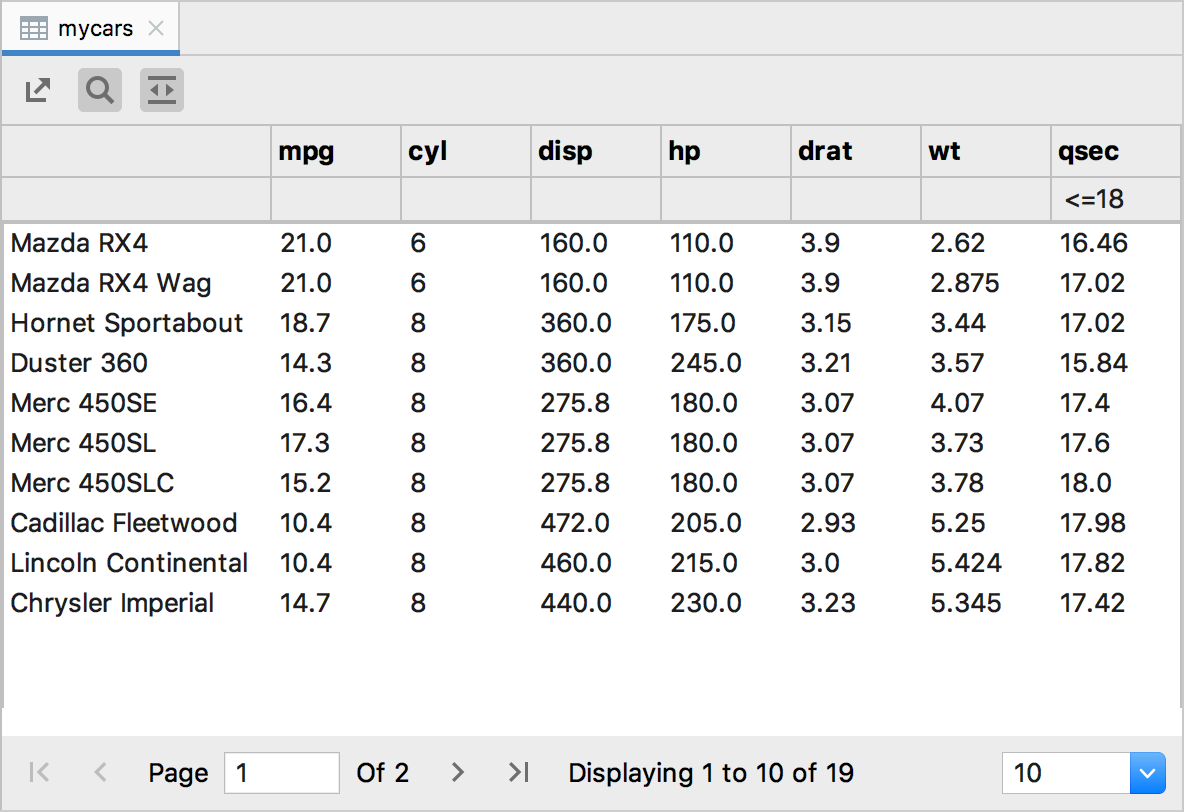
| Item | Description |
|---|---|
| Save the table in a .csv file. | |
Filter data in the table columns. Hover over the button to preview the available filters and type the filter criteria under the column header. 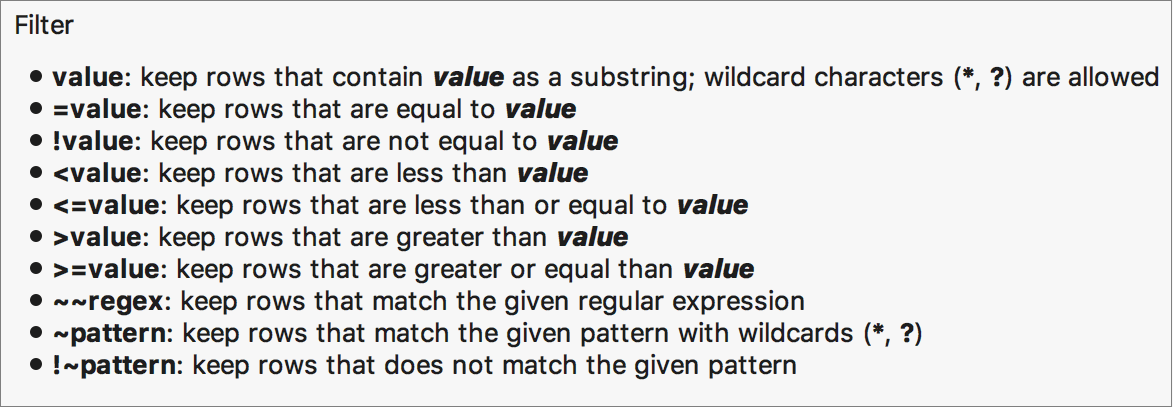 | |
| Organize table in pages. Toggle this button and specify the number of table rows to display on a page: 10, 15, 30, or 100. |
Viewer
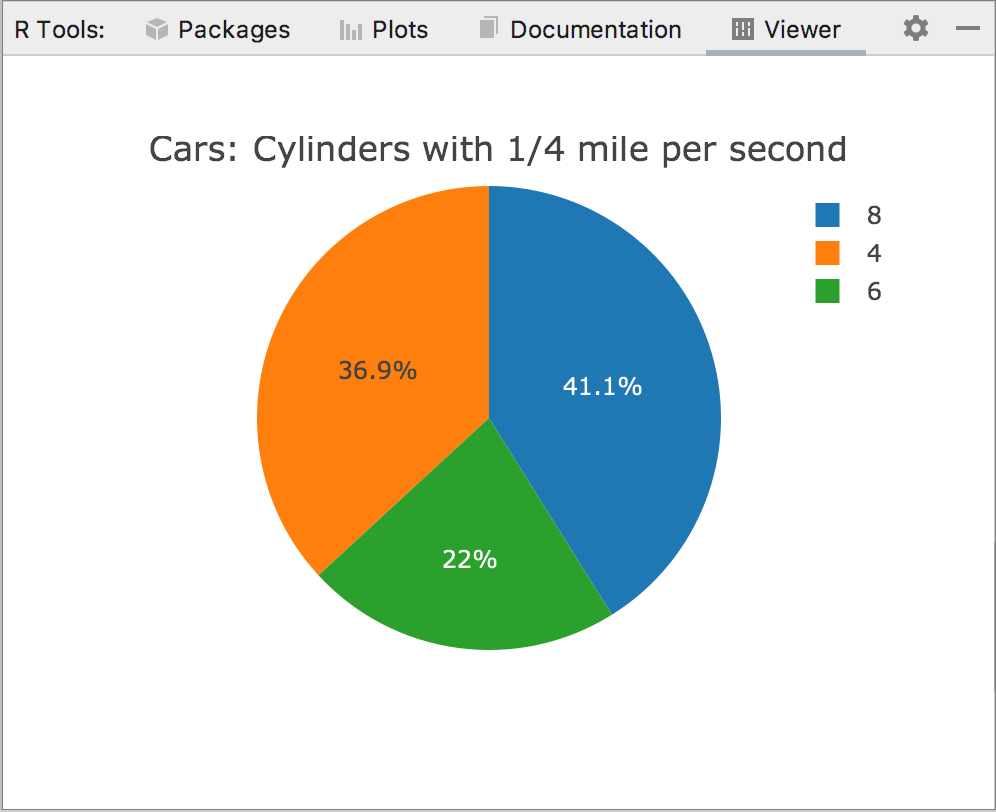
With the Viewer tab of the R Tools window you can preview R graphics built with the JavaScript visualization libraries.
R packages
Install, uninstall, and update R packages in the Packages tab of the R Tools window. It lists all the installed R packages.
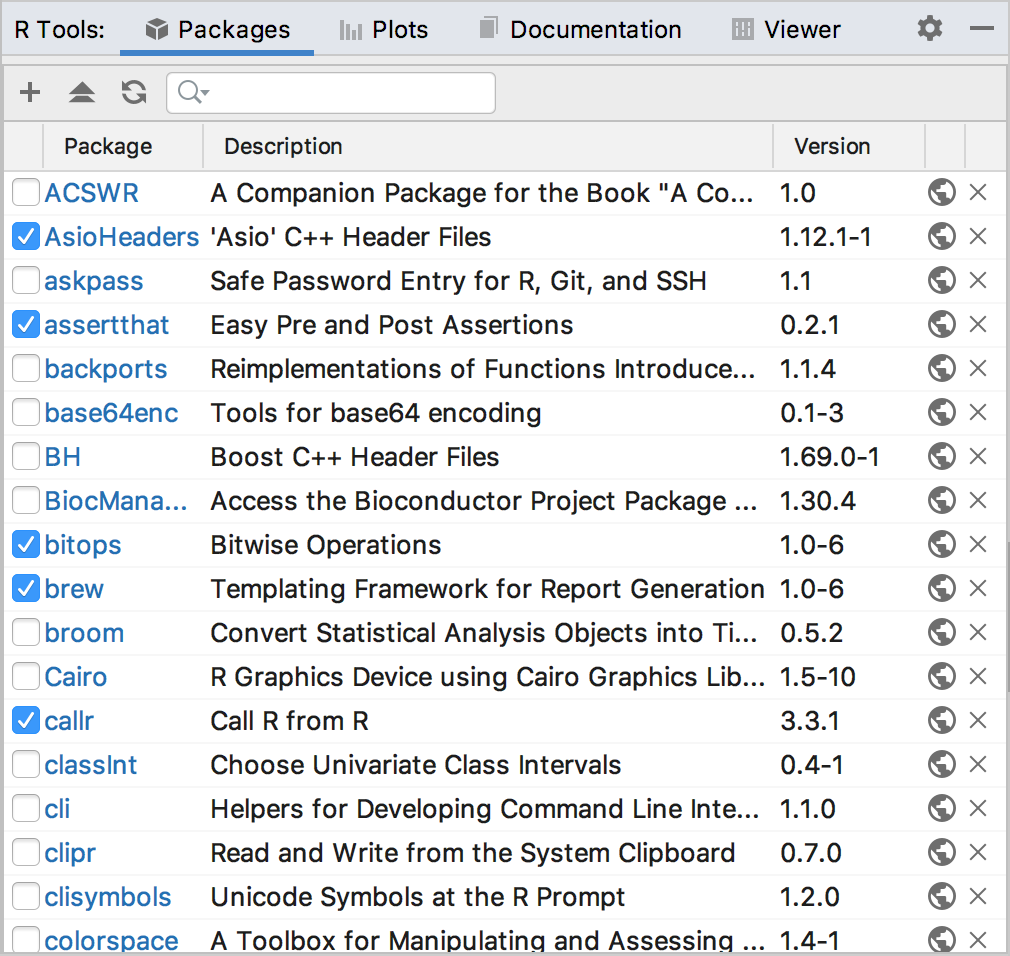
| Item | Description |
|---|---|
| Install an R package from the list of the available packages. | |
| Upgrade all packages to the latest available versions. This button is enabled if at least for one of the installed packages there is a newer version. | |
| Update the Latest version column by fetching the latest available versions for the installed packages. |
R files toolbar
When you open an R file in the editor, the following toolbar appears. Use it to run and debug R code.
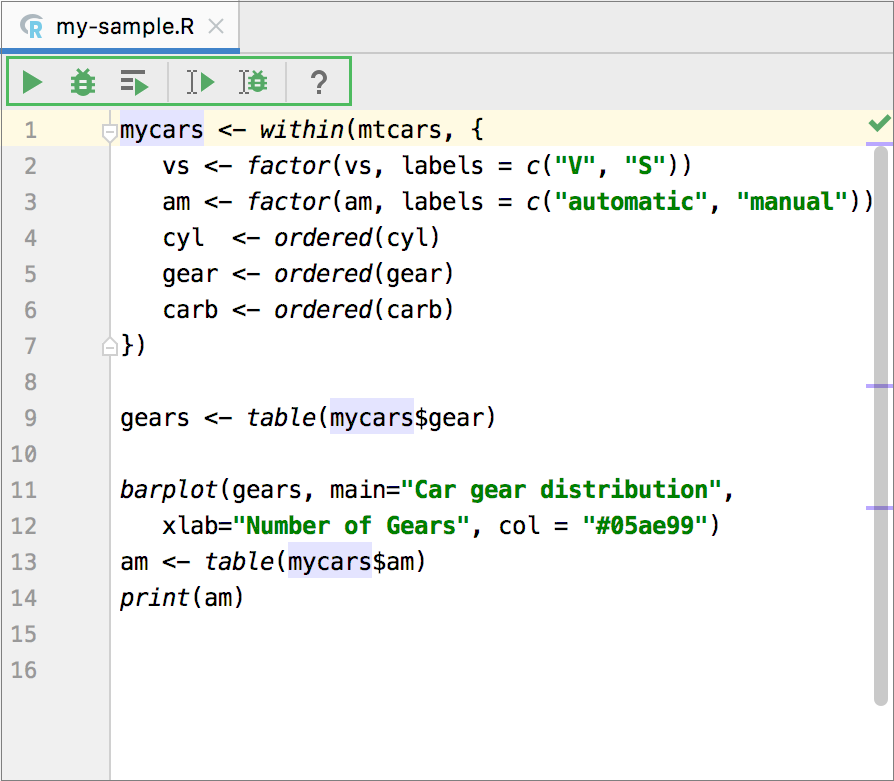
| Item | Description |
|---|---|
| Execute the R file. | |
| Debug the R file | |
| Run a job for an R file | |
| Execute the selected code fragment | |
| Debug the selected code fragment | |
| Open the Documentation tab. |
Markdown toolbar
The toolbar appears the editor window when you open an .rmd file.
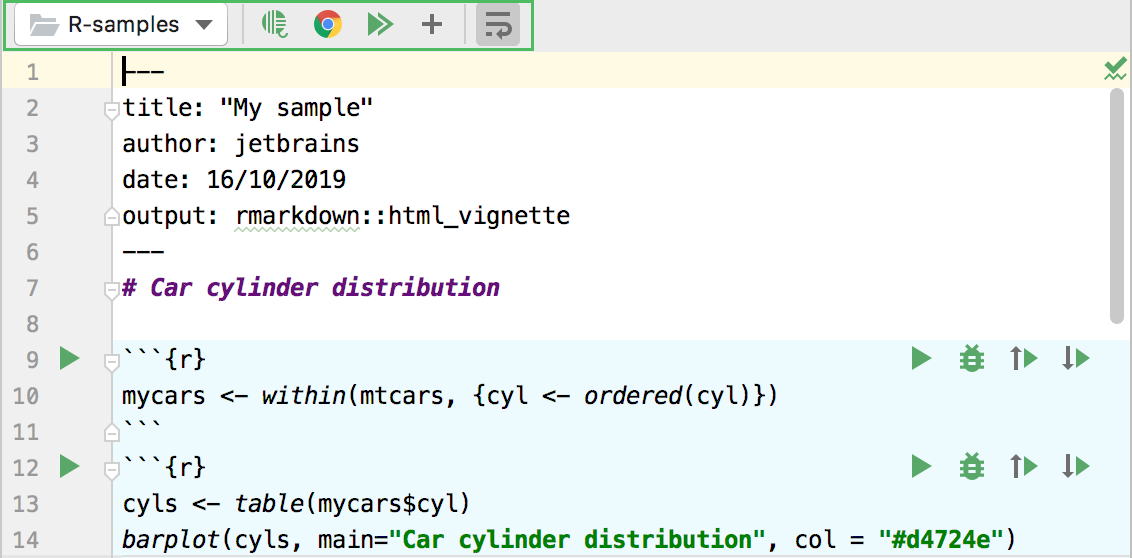
| Item | Description |
|---|---|
| Output directory | Select the directory for the generated HTML output. By default, the project directory is selected. To alter the location, select Custom from the list and specify any directory in your file system. |
| Renders the document in the HTML format. The filename corresponds to name of the R Markdown file. The location of the generated file is defined by the option selection in the Output Directory list. | |
| Opens the generated HTML document. Note that you should build the output first ( | |
| Runs all the executable R chunks in the file. During the execution the icon changes its state to | |
| Inserts a new chunk for R code below the current chunk. | |
| Softly wraps lines in the editor. |
Refer to the following topics for more information about R plugin support in PyCharm: