Run/debug configurations
Configure: Run | Edit Configurations
PyCharm uses run/debug configurations to run, debug, and test your code. Each configuration is a named set of run/debug startup properties.
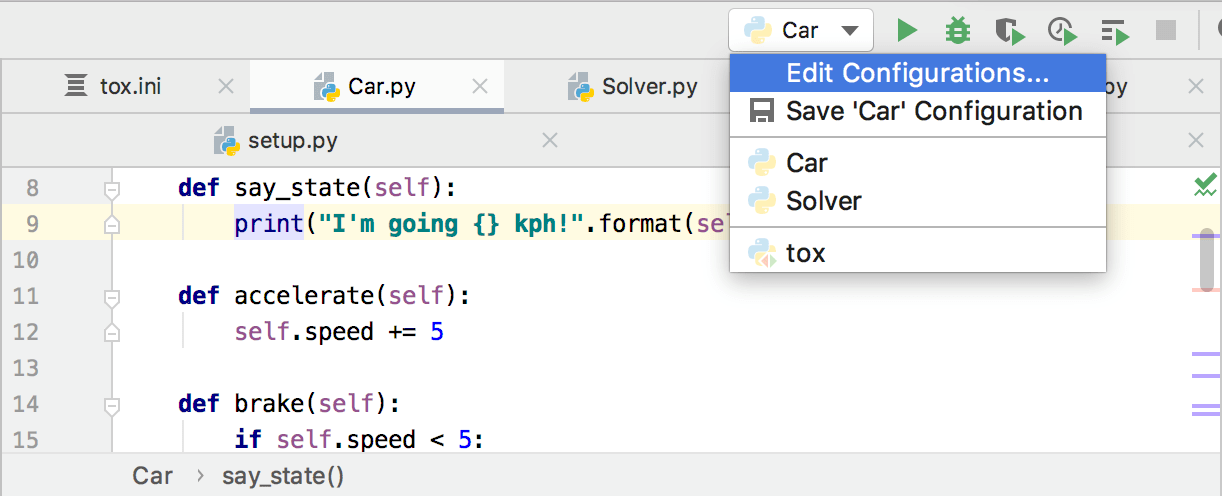
If the Navigation bar is visible (View | Appearance | Navigation Bar), you can access all available run/debug configurations from the selector on the toolbar.

Run/debug configurations can be created as:
Temporary– created every time you run or debug functions or tests.
The maximum number of temporary configurations is 5. The older ones are automatically deleted when new ones are added.Permanent– created explicitly from a template or by saving a temporary configuration. Permanent configurations remain as part of your project until you remove them.
So whenever you run/debug or test your code, PyCharm either uses an existing permanent run/debug configuration or creates a new temporary one.
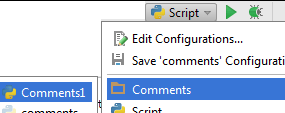
Permanent configurations have opaque icons while the icons of temporary configurations are semi-transparent.
Create permanent run/debug configurations
PyCharm provides the following ways to create a permanent run/debug configuration:
Create from a template or copy an existing configuration.
Save a temporary configuration as permanent
Select a temporary configuration in the run/debug configuration switcher and then click Save Configuration.
Once you save a temporary configuration, it becomes permanent and it is recorded in a separate XML file in the <project directory>
/.idea/ directory. For example, MyProject/.idea ./Car.xml Alternatively, select a temporary configuration in the Run/debug configurations dialog and click
on the toolbar.
PyCharm provides run/debug configuration templates for different languages, tools, and frameworks. The list of available templates varies depending on the installed/bundled plugins.
Create a run/debug configuration from a template
Open the Run/Debug Configuration dialog in one of the following ways:
Select Run | Edit Configurations from the main menu.
With the Navigation bar visible (View | Appearance | Navigation Bar), choose Edit Configurations from the run/debug configuration selector.
Press Alt+Shift+F10, then press 0 or select the configuration from the popup and press F4.
In the Run/Debug Configuration dialog, click
on the toolbar or press Alt+Insert. The list shows the run/debug configuration templates.
Select the desired template. If you are not sure which template to choose, refer to Run/debug configurations dialog for more information on particular templates.

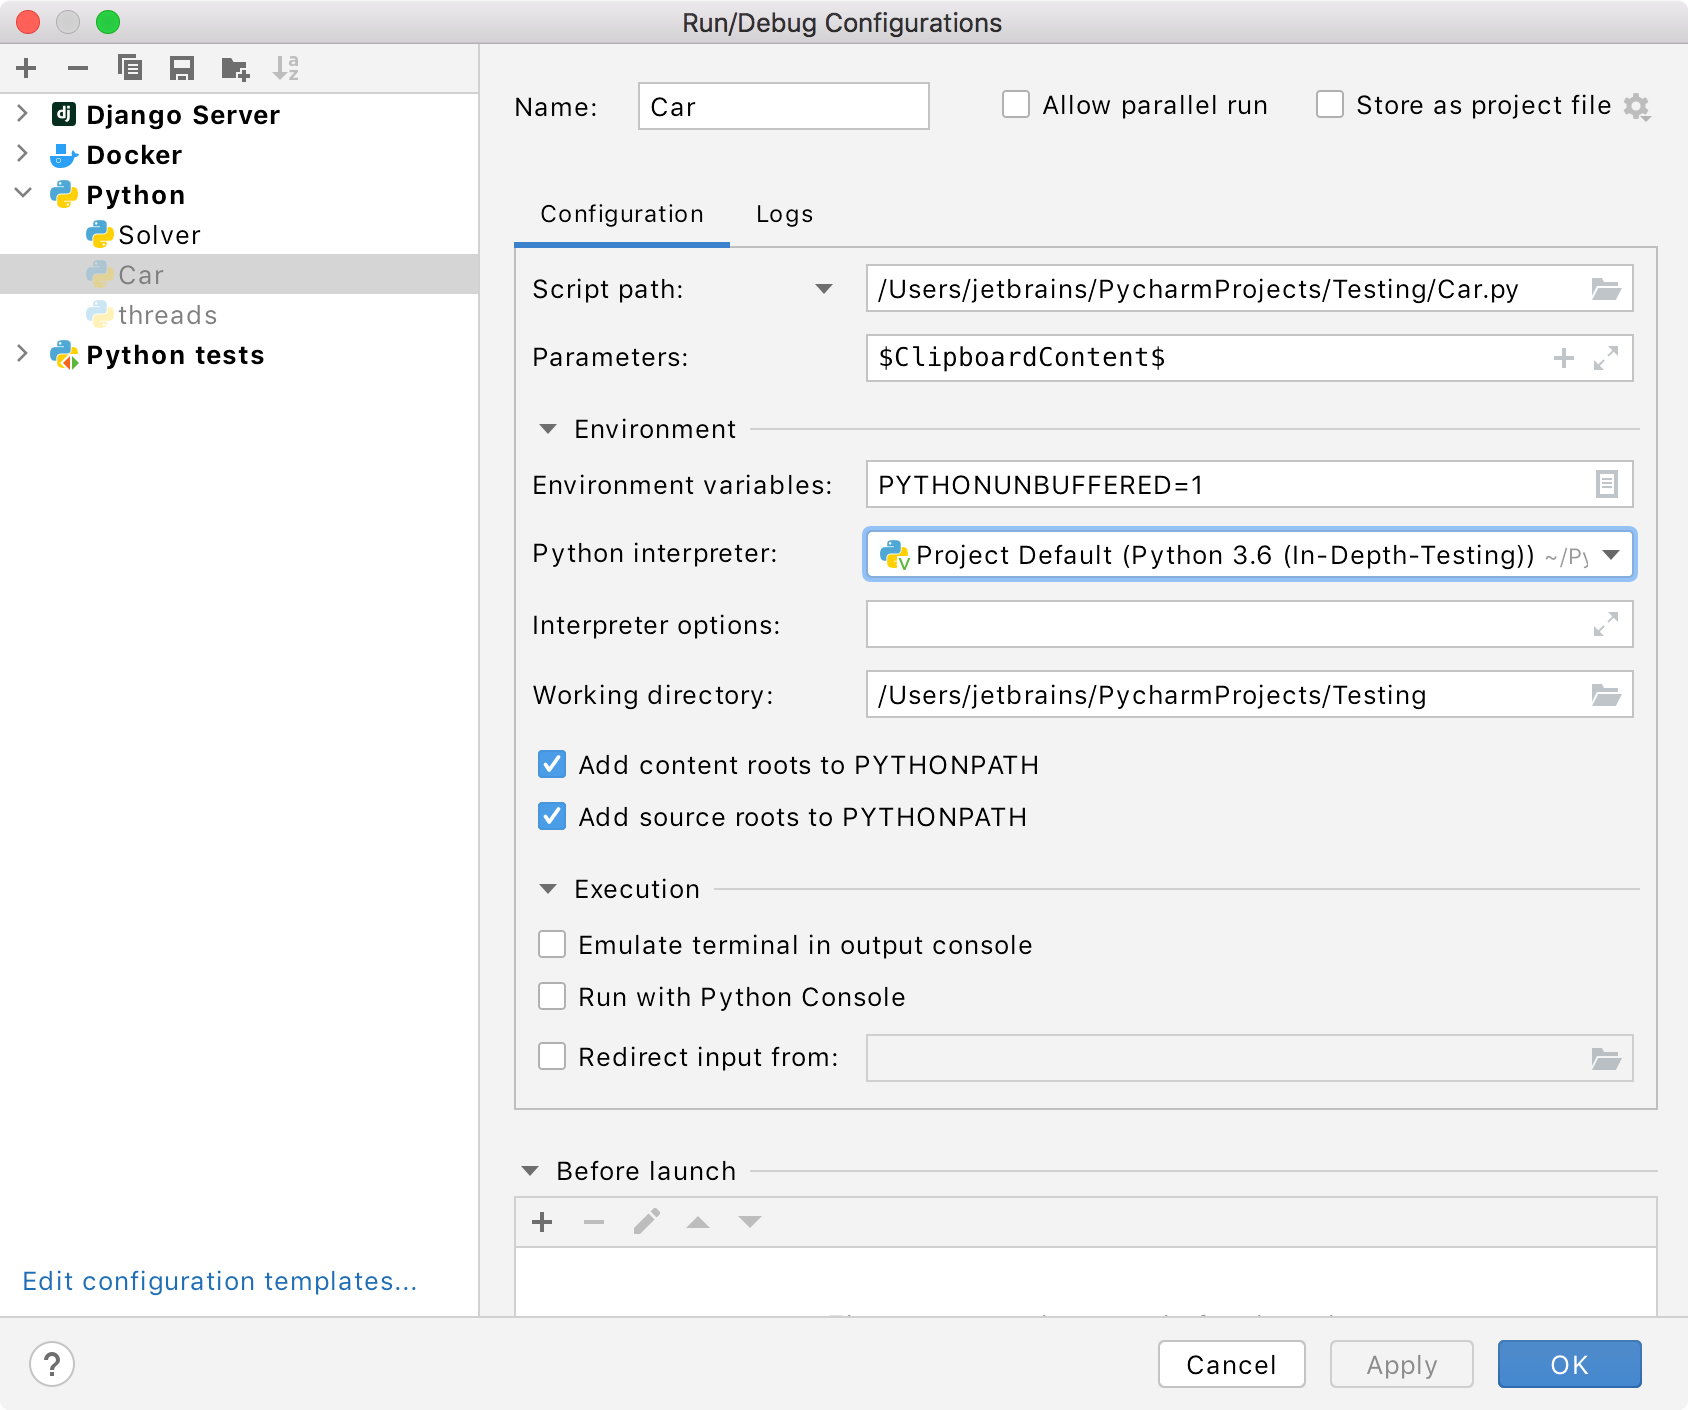
Specify the run/debug configuration name in the Name field. This name will be shown in the list of the available run/debug configurations.
Select Allow parallel run if you want to allow multiple instances of the configuration to run at the same time. If this option is disabled, attempting to re-run the configuration will terminate the active session.
Set the run/debug configuration parameters.
In the Before launch section, define whether you want to perform any specific actions before launching the application, for example, execute some tools or scripts prior to launching the run/debug configuration.
For information on particular Before launch activities, refer to Before Launch
Apply the changes and close the dialog.
Share run/debug configurations
If you are working in a team, you might want to share your run/debug configurations so that your teammates could run the application using the same configuration or enable them to remotely attach to the process you are running.
For these purposes, PyCharm provides a mechanism to store your run/debug configurations as project files and share them through VCS. The same mechanism can also be used when you want to send your configuration as a file to someone else. This saves a lot of time as run/debug configurations sometimes get sophisticated, and keeping them in sync manually would be tedious and error-prone.
note
Legacy .ipr -based projects do not support individual run/debug configurations. With legacy projects, you can only share all configurations at once by adding the .ipr file to the VCS.
From the main menu, select Run | Edit Configurations. Alternatively, press Alt+Shift+F10, then 0.
Select the run/debug configuration you want to share, enable the Store as project file option, and specify the location where the configuration file will be stored.
If compatibility with PyCharm 2019.3 and earlier is required, store the file in the default location.
(Optional) If the .idea directory is added to VCS ignored files, the .idea/runConfigurations subfolder will be ignored, too. If you use Git for your project, you can share .idea/runConfigurations only and leave .idea ignored by modifying .gitignore as follows:
/.idea/*
!/.idea/runConfigurations
note
Turning on the Store as project file option does not submit anything to the VCS for you. For run/debug configurations to make their way to a shared repository, you have to check them in like other versioned files.
To learn how to use version control systems in PyCharm, refer to the Version control section.
Run/debug configuration templates
Each type of run/debug configuration is a template that you can edit, so the next time you create a new configuration of that type, its parameters already have the desired values.
note
Changing the default values of a template does not affect already existing run/debug configurations.
warning
Do not set up a working directory for the default Run/Debug Configurations listed under the Templates node. This may lead to unresolved targets in newly created Run/Debug Configurations.
Configure the default values for a template
From the main menu, select Run | Edit Configurations. Alternatively, press Alt+Shift+F10, then 0.
In the left-hand pane of the run/debug configuration dialog, click Edit configuration templates.
In the Run/Debug Configuration Templates dialog that opens, select a configuration type.

Specify the desired default parameters and click OK to save the template.
Compound run/debug configurations
Suppose you would like to launch multiple run/debug configurations simultaneously. For example, you may want to run several configurations of different types or a sequence of several test configurations. You can configure this behavior with a compound run/debug configuration.
When you run or debug your code using a compound configuration, you actually launch a sequence of configurations in the order they are listed.
Create a compound run/debug configuration
From the main menu, select Run | Edit Configurations. Alternatively, press Alt+Shift+F10, then 0.
In the Run/Debug Configurations dialog, click
or press Alt+Insert, then select Compound.
Specify the run/debug configuration name in the Name field. This name will be shown in the list of the available run/debug configurations.
Select Store as project file to make this run/debug configuration available to other team members.
To include a new run/debug configuration into the compound configuration, click Add
and select the desired one from the list.
Apply the changes.
Run/debug configuration folders
When there are many run/debug configurations of the same type, you can group them in folders so they become easier to distinguish visually.
Once grouped, the run/debug configurations appear in the list under the corresponding folders.

Create a folder for run/debug configurations
From the main menu, select Run | Edit Configurations. Alternatively, press Alt+Shift+F10, then 0.
In the Run/Debug Configurations dialog, select a configuration type and click
on the toolbar. A new empty folder for the selected type is created.
Specify the folder name in the text field to the right or accept the default name.
Select the desired run/debug configurations and move them under the target folder.
Apply the changes. If a folder is empty, it will not be saved.
When you no longer need a folder, you can delete it Delete. The run/debug configurations grouped under this folder will be moved under the root of the corresponding run/debug configuration type.
Run/Debug configurations in the Services tool window
You can manage multiple run/debug configurations in the Services tool window. For example, you can start, pause, and stop several applications, track their status, and examine application-specific details.
Add Run/Debug configurations to the Services window
Select View | Tool Windows | Services from the main menu or press Alt+8.
In the Services tool window, click Add service, then select Run Configuration Type.

Select a run/debug configuration type from the list to add all configurations of this type to the window.
Note that the tool window will only display the configuration types for which you have created one or more configurations.
Run/Debug configuration parameters
| Item | Description | ||||||||
|---|---|---|---|---|---|---|---|---|---|
| Script path/Module name | Click the list to select a type of target to run. Then, in the corresponding field, specify the path to the Python script or the module name to be executed. | ||||||||
| Parameters | In this field, specify parameters to be passed to the Python script. When specifying the script parameters, follow these rules:
In this field you can add a macros to pass various project- or context-specific values when running a run/debug configuration. Click + and select one of the available macros from the list. See Adding macros to run/debug configuration for more details. | ||||||||
| Environment | |||||||||
| Environment variables | This field shows the list of environment variables. If the list contains several variables, they are delimited with semicolons. By default, the field contains the variable PYTHONUNBUFFERED set to 1. To fill in the list, click the browse button, or press Shift+Enter and specify the desired set of environment variables in the Environment Variables dialog. To create a new variable, click | ||||||||
| Python Interpreter | Select one of the pre-configured Python interpreters from the list.
| ||||||||
| Interpreter options | In this field, specify the command-line options to be passed to the interpreter. If necessary, click | ||||||||
| Working directory | Specify a directory to be used by the running task.
| ||||||||
| Add content roots to PYTHONPATH | Select this checkbox to add all content roots of your project to the environment variable PYTHONPATH; | ||||||||
| Add source roots to PYTHONPATH | Select this checkbox to add all source roots of your project to the environment variable PYTHONPATH; | ||||||||
| Execution | |||||||||
| Emulate terminal in output console | Enables running your script or module in the output console with the emulated terminal mode. This mode can be helpful for the tasks that cannot be implemented with the standard output console, for example, when your script performs caret return actions (print(i, flush=True , end='\r'). Note that emulating terminal in the output console differs from running the Terminal that is a separate tool window used for running system shell commands. | ||||||||
| Run with Python console | Enables running your script or module with the Python console. | ||||||||
| Redirect input from | Enables redirecting data from a text file to standard input. Use this option if your script requires some input and you want to automatically submit the values instead of typing them in the Run console. To enable redirecting, select the checkbox and specify the path to the target text file. | ||||||||
Docker container settings
Click | |||||||||
| Options |
Click | ||||||||
Docker Compose
| |||||||||
| Commands and options | You can use the following commands of the Docker Compose Command-Line Interface:
| ||||||||
| Command Preview | You can expand this field to preview the complete command string. Example: if you enter the following combination in the Commands and options field: up --build exec --user jetbrainsthe preview output should looks as follows: | ||||||||
