Detect code issues in design time
JetBrains Rider starts analyzing a code file as soon as you open it in the editor, all the way you edit it, until it is closed. All detected code issues are highlighted in the editor according to their severity levels. The map of the issues is also displayed on the error stripe in the right part of the editor window, where you can see instantly the status of the file and click the marks to navigate to specific code issues.
Design-time inspection features
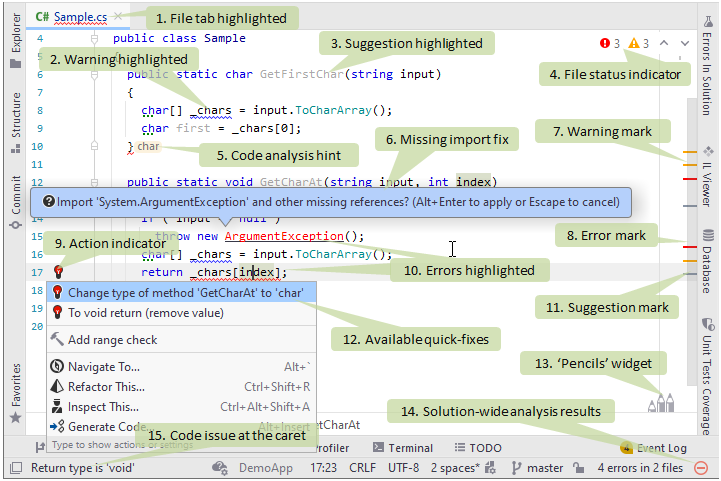
Design-time inspection features is a major addition to the basic features of Rider editor. To illustrate the design-time code inspection performed by JetBrains Rider, consider the following code excerpt displayed in the editor:

In this example, we can see the following features of JetBrains Rider code inspection:
If the solution-wide analysis is enabled, all files that contain errors are shown with highlighted tabs.
A medium-priority code issue (in this case, a warning about a symbol name that does not match the naming style) is highlighted with a blue curly underline.
A low-priority code issue (in this case, a suggestion related to an unused public member) is greyed out.
A Status indicator helps you to quickly see whether the current file has any errors or warnings.
Code analysis hints make missing function returns, missing breaks in switch statements, and disposed resources easier to notice.
A fix popup that appears for non-imported types. Simply press Alt+Enter or click this popup to have JetBrains Rider add the missing directive for all types in the file. For more information, see Import missing namespaces.
A marker corresponding to a warning is displayed on the error stripe.
A marker corresponding to an error is displayed on the error stripe.
An action indicator that appears to the left of the caret position if JetBrains Rider has anything to suggest there.
High-priority code issues (in this case, errors related to an unresolved symbol and an incorrect return type) are highlighted with red text and a red curly underline.
A marker corresponding to a suggestion is displayed on the error stripe.
The action list, which can be opened by pressing Alt+Enter or clicking the action indicator (7), contains a list of quick-fixes for the issue at the caret.
The 'Pencils' widget helps you to configure highlighting and visual helpers for your code.
If solution-wide analysis is enabled, JetBrains Rider allows you to see even more code issues. In this example, it detects the unused public member and notifies you of errors in other files in your solution. Click the solution-wide analysis icon to explore the detected issues.
A short description of the issue at the caret appears in the status bar. To view descriptions of code issues, hover the mouse over the highlighted code or over the issue markers on the error stripe.
Toggle design-time inspection
By default, design-time code inspection is enabled in all supported languages. However, you can disable it everywhere or turn it off for specific files if needed. For more information on configuring code inspection, see Configure code inspection settings.
Press Ctrl+Alt+S or choose (Windows and Linux) or (macOS) from the menu, then choose on the left.
Use the Enable code analysis checkbox to toggle the design-time code inspection.
Optionally, you can enable or disable design-time inspection features on this page:
Color identifiers
This option lets you enable or disable syntax highlighting scheme.
If it is selected, language identifiers are highlighted with colors as defined in settings pages under the page of JetBrains Rider settings Ctrl+Alt+S. in Visual Studio options: .
Note that by disabling this option you also disable symbol information tooltips that appear on mouse over.
Highlight color usages
Enables highlighting of color definitions in code. For more information, see Color assistance.
Highlight special characters in string literals
Enables highlighting of correct and incorrect escape sequences in non-verbatim strings. For example:

For more information, see Regular expressions assistance.
Highlight context exits
This option, which is enabled by default, tells JetBrains Rider to highlight all places where the control flow can exit the current context. For example, for a method, it will highlight the return type of the method, all
return,throwkeywords, and so on when you set the caret to one of these identifiers
For a loop, it will additionally highlight the loop keyword as well as all the
breakstatements inside this loop.Note that if a method is not entirely visible in the editor, you can invoke the Navigate To Function Exits command on the method name to trigger another kind of highlighting, which will not disappear when your caret leaves the method name.
Highlight related async/await keywords
If necessary, you can select the Enable solution-wide analysis checkbox to enable the Solution-wide analysis.
Click Save in the Settings dialog to apply the modifications and let JetBrains Rider choose where to save them, or save the modifications to a specific settings layer using the Save To list. For more information, see Layer-based settings.
Navigate code issues
If the design-time code inspection is enabled, you can easily navigate between all issues (except those with the hint severity level) detected in the current file.
Navigate to the next/previous code issue in the current file
Press F2 to go to the next code issue, or Shift+F2 to go to the previous code issue.
In the main menu, choose or. .
Use the error stripe on the right side of the editor window: clicking on markers brings the caret to the corresponding issues; clicking on the status indicator on top of the error stripe brings the caret to the next issue in the file.
Navigate to the next/previous error
Press Alt+F2 to go to the next error, or Alt+Shift+F2 to go to the previous error.
If the Solution-wide analysis is enabled and there are some errors, the number of errors is displayed in the right corner of the status bar. You can click this number to go to the next error in the solution.
Inspection options menu
Besides suggested fixes, for each configurable code inspection as well as for custom inspections, JetBrains Rider shows the Inspection [name of inspection] ![]() sub-menu in the actions list, with the following items:
sub-menu in the actions list, with the following items:
For the most controversial issues, there is the Why is JetBrains Rider suggesting this? item that opens a Code inspection index page with detailed description of the corresponding inspection.
![Inspection [name of inspection] sub-menu Inspection [name of inspection] sub-menu](https://resources.jetbrains.com/help/img/rider/2021.2/code_inspection_menu.png)
Find similar issues
You can not only fix a highlighted issue with a quick-fix, but also find and investigate all similar issues (all issues detected with the same code inspection) in the whole solution or smaller scope.
Find similar issues
Set the caret at a highlighted issue in the editor.
Press Alt+Enter or click the action indicator to the left of the caret to open the action list.
To find similar issues in the current file, choose Inspection [name of inspection] | Find similar issues in [filename] file.
To find similar issues in the current project or solution, expand the submenu and choose the desired scope:

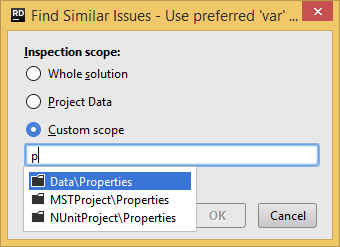
If necessary, you can search for similar issues in any project or solution folder within your solution. To do so, choose Find similar issues in custom scope in the submenu.
In the dialog that opens, type the name of the desired project or solution folder, and then click OK.

All found issues will be displayed in the Inspection Results window.