Configure code inspection settings
tip
You can also use code annotations to customize the way JetBrains Rider inspects your code.
Configure design-time code inspection
By default, JetBrains Rider enables design-time code inspection in all files corresponding to the supported languages. If necessary, you can disable it. Regardless of whether or not the design-time code inspection is enabled, you can always run code inspection in specific scope.
You can quickly adjust inspection settings right from the editor, using the 'Pencils' widget or go for a more detailed configuration in the settings:
Press Ctrl+Alt+S or choose File | Settings (Windows and Linux) or JetBrains Rider | Preferences (macOS) from the menu , then choose Editor | Inspection Settings on the left.
Use the Enable code analysis checkbox to toggle the design-time code inspection.
Optionally, you can enable or disable design-time inspection features on this page:
Color identifiers
This option lets you enable or disable syntax highlighting scheme.
If it is selected, language identifiers are highlighted with colors as defined in settings pages under the Editor | Color Scheme page of JetBrains Rider settings Ctrl+Alt+S. in Visual Studio options: Tools | Options | Environment | Fonts and Colors.
Note that by disabling this option you also disable symbol information tooltips that appear on mouse over.
Highlight color usages
Enables highlighting of color definitions in code. For more information, see Color assistance.
Highlight special characters in string literals
Enables highlighting of correct and incorrect escape sequences in non-verbatim strings. For example:

For more information, see Regular expressions assistance.
Highlight context exits
This option, which is enabled by default, tells JetBrains Rider to highlight all places where the control flow can exit the current context. For example, for a method, it will highlight the return type of the method, all
return,throwkeywords, and so on when you set the caret to one of these identifiers
For a loop, it will additionally highlight the loop keyword as well as all the
breakstatements inside this loop.Note that if a method is not entirely visible in the editor, you can invoke the Navigate To Function Exits command on the method name to trigger another kind of highlighting, which will not disappear when your caret leaves the method name.
Highlight related async/await keywords
This option enables highlighting of all
asyncandawaitkeywords in a function when your caret is on one of them.Highlight condition elements
This option enables highlighting of matching logical and conditional operators (
|,||,&,&&, as well as?and?pairs) that work together in a complex expressions when your caret is at one of such operators.In the example below, %product helps understand that the highlighted operators will be evaluated together, while the
value1 > 1 || value2 >= 2 && condition1part will be evaluated before, and the|| value6 %lt; value7 || condition2part will be evaluated after, according to the operator precedence.
If necessary, you can select the Enable solution-wide analysis checkbox to enable the Solution-wide analysis.
Click Save in the Settings dialog to apply the modifications and let JetBrains Rider choose where to save them, or save the modifications to a specific settings layer using the Save To list. For more information, see layer-based settings.
Configure target framework for analysis
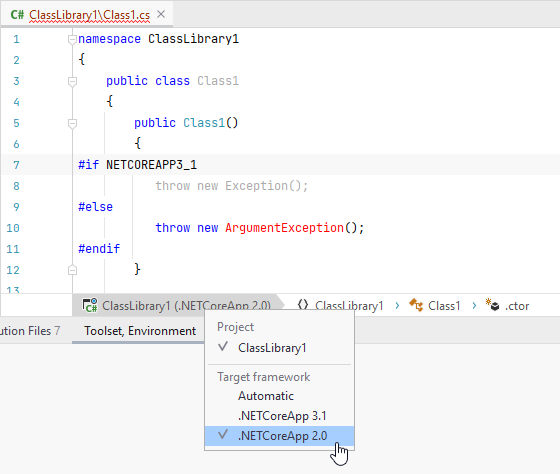
If the current file is included in a project that targets multiple frameworks, you can choose which framework should be used when analyzing the project. The currently selected framework is shown in the first element of the editor breadcrumbs. If there are several target frameworks in the project, you can click this element and change the framework used for analyzing all files in that project:

In the example above there are two unresolved calls in the file — Exception() and ArgumentException() — but only the second call is highlighted as error because the first one if filtered out for .NETCoreApp 3.1 with the #IF directive and .NETCoreApp 2.0 is selected for analysis.
note
Target frameworks for solution-wide analysis are configured independently of the framework that is used for the design-time analysis.
Exclude files and folders from code inspection
JetBrains Rider allows you to configure the list of files, file masks, and folders that should be excluded from code inspection. The excluded items are ignored by both design-time code inspection and code inspection in specific scope, but they are still indexed by JetBrains Rider, so that you can navigate to or refactor symbols excluded from code inspection.
Exclude specific files and folders from code inspection
Press Ctrl+Alt+S or choose File | Settings (Windows and Linux) or JetBrains Rider | Preferences (macOS) from the menu , then choose Editor | Inspection Settings on the left.
In the left part of the Elements to skip section, you can specify files or folders to be ignored by the code inspection.
In the right part of this section, you can specify masks (for example *.vb) that will exclude all matching files in the solution from code inspection.
Click Save in the Settings dialog to apply the modifications and let JetBrains Rider choose where to save them, or save the modifications to a specific settings layer using the Save To list. For more information, see layer-based settings.
You can also quickly exclude the current file from code inspection so that JetBrains Rider adds this file to the list of excluded files without opening the options.
Exclude/include current file from/to code inspection
Press Ctrl+Alt+Shift+8.
You can recognize files where code inspection is disabled by the ![]() indicator in the top right corner of the editor.
indicator in the top right corner of the editor.
Partly disable code inspection for generated code
You can also configure the list of files, folders, file masks, and regions that contain generated code. For these items, JetBrains Rider runs only those code inspections that check code for compiler errors and warnings. Some file masks and regions, which are typically used for generated code, for example *.designer.cs are included in this list by default, but you can change the default settings if necessary.
If you use .editorconfig in your solution, you can also mark generated code using the generated_code property. For example:
[*generated.cs]
generated_code = true
Specify files and regions with generated code
On the Editor | Inspection Settings | Generated Code page of JetBrains Rider settings Ctrl+Alt+S, use the Add button to specify files or folders that contain generated code.
In the lower left part of the page, use the Add button to specify masks (for example *.Designer.cs) for generated code files.
In the lower right part of the page, use the Add button to specify names of the regions that contain generated code.
Click Save in the Settings dialog to apply the modifications and let JetBrains Rider choose where to save them, or save the modifications to a specific settings layer using the Save To list. For more information, see layer-based settings.
The list of items containing generated code can also be used for disabling code cleanup for generated code.
Change severity levels of code inspections
Each JetBrains Rider's code inspection has its own default severity level, which is set according to potential impact of code issues that it detects. Most of the inspections have configurable severity level, which you can change.
Note that inspections that detect compiler errors and warnings have corresponding severity levels, which cannot be changed. However, with some compiler warnings, you can use #pragma directives to suppress them. Look for the suppress with #pragma action in the action list upon a specific warning.
You can change severity level of an inspection right from the editor, where a code issue found by this inspection is highlighted.
Change inspection severity from the editor
Set the caret to a code issue highlighted by a JetBrains Rider's inspection.
Press Alt+Enter or click the action indicator to the left of the caret to open the action list.
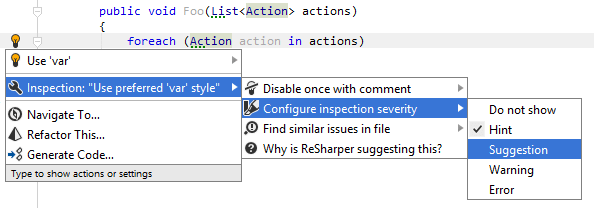
In the action list, choose Inspection [name of inspection] | Configure inspection severity and then select a new severity level:

Your change will be saved using the smart save logic.
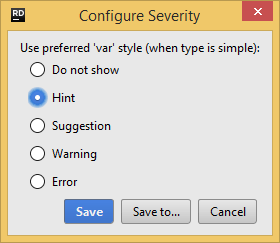
If you need to save the modified severity level in a shared settings layer, click the Configure inspection severity menu item or press Enter when it is selected. In the dialog that appears, choose the desired severity level, click Save To and then choose the desired settings layer.

Another way to save the modified severity level in a shared settings layer, or modifying severity levels of multiple inspections is using the JetBrains Rider Settings dialog Ctrl+Alt+S as described below.
Modify severity levels of code inspections from settings
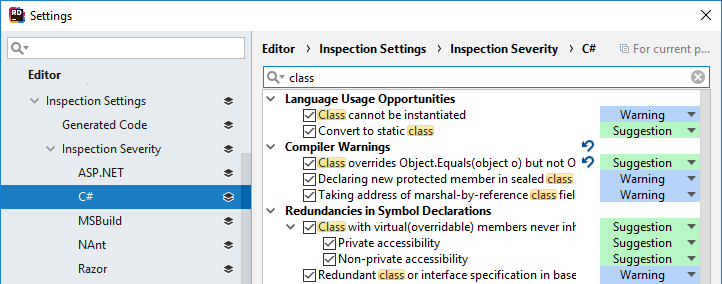
On the Editor | Inspection Severity page of JetBrains Rider settings Ctrl+Alt+S, you can view all configurable code inspections and their severity levels. The inspections are grouped by languages and then by categories.
Find and select the inspection whose severity you want to modify.
Click the list to the right of the selected entry, and choose a desired severity level:

If the default severity level of an inspection is changed, you will see the Reset to default
.png) button next to it, which allows you to reset the severity to its default value.
button next to it, which allows you to reset the severity to its default value.Click Save in the Settings dialog to apply the modifications and let JetBrains Rider choose where to save them, or save the modifications to a specific settings layer using the Save To list. For more information, see layer-based settings.
Disable/enable specific code inspections
If some code inspection seems trivial or being of no interest to you, you can disable this inspection so that no relevant issues would be highlighted in the editor or detected when you run code inspection in specific scope. You can enable a disabled code inspection any time later. Some inspections are disabled by default and you can enable them if necessary.
You can disable any code inspection in one of the following ways:
If there is a code issue highlighted by this inspection in the editor, set the caret at the highlighted code, press Alt+Enter and then choose Inspection [name of inspection] | Configure inspection severity | Do not show.
On the Editor | Inspection Severity page of JetBrains Rider settings Ctrl+Alt+S, use the search box to find the inspection you want to disable or enable, and then use the checkbox next to it.
The disabled/enabled state of inspections is saved in the shared settings layers, exactly the same way as changes to severity levels.
Use EditorConfig to configure code inspections
If you use EditorConfig to maintain code styles for your project, you can also configure code inspections from .editorconfig files.
To configure code inspections from EditorConfig, you have to select the Read settings from editorconfig, project settings and rule sets checkbox on the Editor | Inspection Settings page of JetBrains Rider settings Ctrl+Alt+S.
As EditorConfig convention suggests, JetBrains Rider will apply inspection settings defined in files named .editorconfig in the directory of the current file and in all its parent directories until it reaches the root filepath or finds an EditorConfig file with root=true. File masks specified in .editorconfig files, for example *Test.cs are also taken into account.
Inspection settings in .editorconfig files are configured similarly to other properties — by adding the corresponding lines:
[inspection_editorconfig_property]=[error | warning | suggestion | hint | none]For example, you can change the severity level of the Possible 'System.NullReferenceException' inspection to Error with the following line:
resharper_possible_null_reference_exception_highlighting=errortip
Inspection settings from .editorconfig files have higher priority than the settings configured on the Editor | Inspection Settings | Inspection Severity page of JetBrains Rider settings Ctrl+Alt+S.
You can find EditorConfig property for each inspection on pages in the Code inspection index section as well as on the Index of EditorConfig properties page. — just use the browser search to find the property for the desired inspection.
Suppress code inspections in specific scope
One way to ignore specific code issues is to disable the corresponding code inspection. In this case, all code issues detected by this inspection will be ignored everywhere.
Sometimes you may need to suppress a specific inspection in a specific place, while continue to detect other similar issues with this inspection in other places.
For example, JetBrains Rider considers some code to be 'dead' and you can see that it is true. The inspection is helpful and you do not want to disable it. However, you may want to use this code later and do not want it to be highlighted in the editor or appear in the inspection results. To do so, JetBrains Rider allows you to suppress inspections with comments or with attributes. Comments are more convenient for arbitrary pieces of code, attributes are preferable to suppress inspections in whole methods or types.
Suppress code inspection in specific scope
Set the caret to a code issue highlighted by a JetBrains Rider's inspection.
Press Alt+Enter or click the action indicator to the left of the caret to open the action list.
In the action list, choose one of the following:
Inspection [name of inspection] | Disable once with comment — this option inserts a single comment
ReSharper disable once [inspection id], which only suppresses the inspection for the first occurrence of the corresponding issue.Inspection [name of inspection] | Disable once with comment | Disable in file with comment — this option inserts a single comment -
ReSharper disable [inspection id]in the beginning of the file. This comment suppresses the inspection for all corresponding issues in the file.Inspection [name of inspection] | Disable once with comment | Disable and restore with comment — this option inserts a pair of comments before and after the issue -
ReSharper disable [inspection id]andReSharper restore [inspection id]. These comments suppress the inspection for all corresponding issues between them.You can then move these comments to other places in the file so that several issues of this type are suppressed. For example, this can be useful to suppress the 'redundant namespace' inspection if you want to keep several unused namespace imports.
Inspection [name of inspection] | Disable once with comment | Disable for method — this option adds the following attribute to the method:
[SuppressMessage("ReSharper", "[inspection id]")]. This attribute suppresses the inspection in the method.Inspection [name of inspection] | Disable once with comment | Disable for class — this option adds the following attribute to the class:
[SuppressMessage("ReSharper", "[inspection id]")]. This attribute suppresses the inspection in the whole class.Inspection [name of inspection] | Disable once with comment | Disable all inspection in file — this option inserts a single comment
ReSharper disable Allin the beginning of the file. This comment suppresses all inspections in the file.If necessary, you can insert the
ReSharper restore Allto enable code inspections after a specific line.
tip
You can find identifiers for each configurable inspection in the Code inspection index — just choose a language page and then use the browser search to find the details of the desired inspection.
To suppress all inspections in a type or a method, add the following attribute: [SuppressMessage("ReSharper", "All")].