Analyze code issues in design time
JetBrains Rider starts analyzing a code file as soon as you open it in the editor, all the way you edit it, until it is closed. All detected code issues are highlighted in the editor according to their severity levels. The map of the issues is also displayed on the error stripe in the right part of the editor window, where you can see instantly the status of the file and click the marks to navigate to specific code issues.
Design-time inspection features
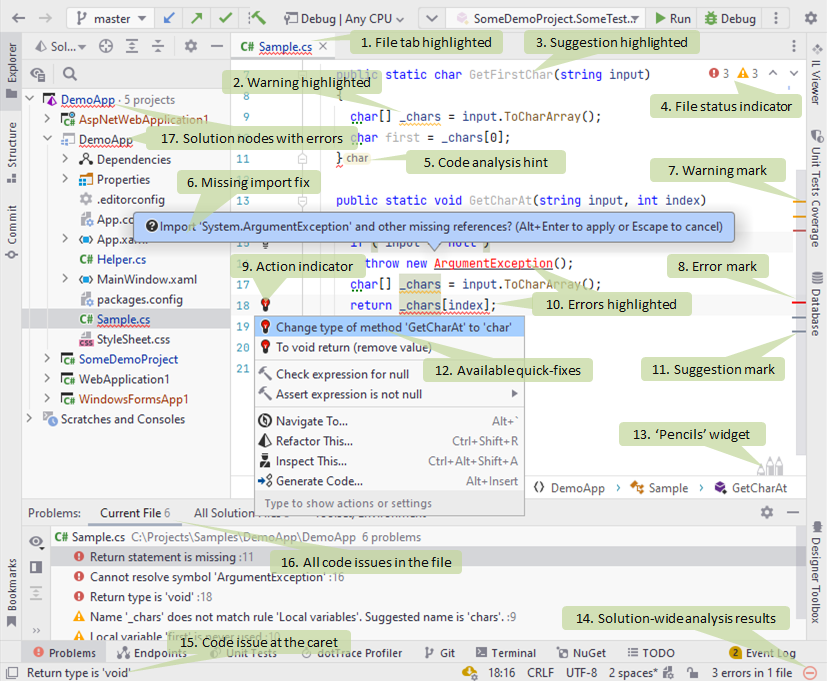
Design-time inspection features is a major addition to the basic features of Rider editor. To illustrate the design-time code inspection performed by JetBrains Rider, consider the following code excerpt displayed in the editor:

In this example, we can see the following features of JetBrains Rider code inspection:
If solution-wide analysis is enabled, all files that contain errors are shown with highlighted tabs.
A medium-priority code issue (in this case, a warning about a symbol name that does not match the naming style) is highlighted with a curly underline.
A low-priority code issue (in this case, a suggestion related to an unused public member) is greyed out.
Status indicator helps you to quickly see whether the current file has any code issues.
Code analysis hints make missing function returns, missing breaks in switch statements, and disposed resources easier to notice.
A fix popup that appears for non-imported types. Simply press Alt+Enter or click this popup to have JetBrains Rider add the missing directive for all types in the file. For more information, see Import missing namespaces.
A marker corresponding to a warning is displayed on the error stripe.
A marker corresponding to an error is displayed on the error stripe.
Action indicator that appears to the left of the caret position if JetBrains Rider has anything to suggest there.
High-priority code issues (in this case, errors related to an unresolved symbol and an incorrect return type) are highlighted with red text and a red curly underline.
A marker corresponding to a suggestion is displayed on the error stripe.
The action list, which can be opened by pressing Alt+Enter or clicking the action indicator, contains a list of quick-fixes for the issue at the caret.
The 'Pencils' widget helps you to configure highlighting and visual helpers for your code.
If solution-wide analysis is enabled, JetBrains Rider allows you to see even more code issues. In this example, it detects the unused public member and notifies you of errors in other files in your solution. Click the solution-wide analysis icon to explore the detected issues.
A short description of the issue at the caret appears in the status bar.
The Problems window Alt+6 lists all code issues in the current file; if solution-wide analysis is enabled, all errors/warnings in solution files are also displayed in the All Solution Files tab.
If solution-wide analysis is enabled, files where JetBrains Rider has detected errors as well as all their parent items are highlighted with red underlines in the Solution Explorer.
View problem description
For each code issue, JetBrains Rider provides a short description that you can view in several ways:
When the caret is at the highlighted code, check the bottom left corner of the status bar.

When the caret is at the highlighted code, press Ctrl+F1 to view the problem description in a tooltip. Alternatively, hover the mouse over any highlighted code.

Hover the mouse over code issue markers on the error stripe.

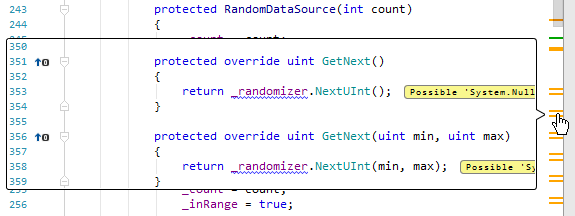
If the code corresponding to the marker is outside the visible editor area, and Show code lens on scrollbar hover is enabled on the page of JetBrains Rider settings Ctrl+Alt+S, this code fragment with the corresponding code issues will appear in a popup when you hover the mouse over the marker.

Use Problems view to study all code issues in the current file
If the design-time code inspection is enabled, you can study code issues in the Problems tool window Alt+6. The Current File tab lists all issues found in the current file; the total number of issues is shown next to the tab title. The list is updated as you switch between files in the editor.

You can select any problem in the window and press F4 or double-click any problem to jump to the corresponding line in the editor.
Alternatively, you can click Open Editor Preview to view the selected issue in its source context right in the Problems window. Note that this preview is a normal editor where you can change the code and apply available quick-fixes.
To filter out issues of specific severity levels and to configure their sorting, click View Options . When no grouping or sorting options are selected, the issues are listed in the order they appear in the file.
Navigate code issues
If the design-time code inspection is enabled, you can easily navigate between all issues (except those with the hint severity level) detected in the current file.
Navigate to next/previous code issue in the current file
Press F2 to go to the next code issue, or Shift+F2 to go to the previous code issue.
In the main menu, choose or .
Use the error stripe on the right side of the editor window: clicking the markers brings the caret to the corresponding issues; clicking the status indicator on top of the error stripe brings the caret to the next issue in the file.
Navigate to next/previous error
Press Alt+F2 to go to the next error, or Alt+Shift+F2 to go to the previous error.
If the Solution-wide analysis is enabled and there are some errors, the number of errors is displayed in the right corner of the status bar. You can click this number to go to the next error in the solution.
When is design-time inspection disabled?
By default, design-time code inspection is enabled in all supported languages, but there are several situations where the analysis may not be available in the current file. You can recognize files where code inspection is disabled by the ![]() indicator in the top right corner of the editor.
indicator in the top right corner of the editor.
- Design-time inspection is disabled globally
You can re-enable it by selecting Enable code analysis on the page of JetBrains Rider settings Ctrl+Alt+S.
- Code inspection is disabled in the current file
The current file is excluded from code analysis: it is listed explicitly, by its containing folder, or by the file mask in the Elements to skip section on the page of JetBrains Rider settings Ctrl+Alt+S.
You can press Ctrl+Alt+Shift+8 to toggle code analysis for the current file; this will also add it to or remove it from the Elements to skip list.
- Design-time code inspection is disabled because the file is too large
To optimize performance and memory consumption, JetBrains Rider automatically disables design-time inspection in files that are larger than
300kilobytes. You can press Ctrl+Alt+Shift+8 in each of such files to enable code analysis.If the file size exceeds
2500kilobytes, then all JetBrains Rider features including coding assistance will be disabled in that file and pressing Ctrl+Alt+Shift+8 will have no effect. This limit can be extended globally with theidea.max.intellisense.filesizeIDE property.- File is not analyzed because it is not included in the solution
JetBrains Rider needs to have a solution model to analyze symbols and references used in each file. Therefore, it cannot analyze files that are not included in the current solution (except some self-contained files such as .xml) .
This often happens with decompiled files and files from symbol servers that open as you navigate compiled code. You normally don't want to analyze such files because there is no way to make meaningful edits to them.
If, on the other hand, you have opened a file for editing by drag-n-dropping it from the system file manager or via , then you either need to open the solution where the file belongs or include the file in the current solution (right-click a target project and choose ).
- An internal error occurred when analyzing the file
In some rare cases, there might be internal errors that prevent JetBrains Rider from analyzing a file. In such cases, clean the analysis indexes and restart the IDE: choose from the main menu.
- Code inspection is partly disabled
If the file is listed explicitly, by its containing folder, or by the file mask as containing generated code, design-time code inspection will only report syntax and compiler errors in that file.
Inspection options menu
Besides suggested fixes, for each configurable code inspection as well as for custom inspections, JetBrains Rider shows the Inspection [name of inspection] ![]() sub-menu in the actions list, with the following items:
sub-menu in the actions list, with the following items:
For the most controversial issues, there is the Why is JetBrains Rider suggesting this? item that opens a help page with detailed description of the corresponding inspection.
![Inspection [name of inspection] sub-menu Inspection [name of inspection] sub-menu](https://resources.jetbrains.com/help/img/rider/2021.3/code_inspection_menu.png)
Find similar issues
You can not only fix a highlighted issue with a quick-fix, but also find and investigate all similar issues (all issues detected with the same code inspection) in the whole solution or smaller scope.
Find similar issues
Set the caret at a highlighted issue in the editor.
Press Alt+Enter or click the action indicator to the left of the caret to open the action list.
To find similar issues in the current file, choose Inspection [name of inspection] | Find similar issues in [filename] file.
To find similar issues in the current project or solution, expand the submenu and choose the desired scope:

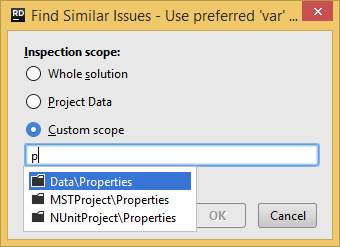
If necessary, you can search for similar issues in any project or solution folder within your solution. To do so, choose Find similar issues in custom scope in the submenu.
In the dialog that opens, type the name of the desired project or solution folder, and then click OK.

All found issues will be displayed in the Inspection Results window.