Code Inspection in F#
JetBrains Rider's code analysis in F# is provided by the F# Compiler Service. Nevertheless, the key code analysis features supported in C# and VB.NET (except for quick-fixes) are also available in F#. For detailed information on these features, refer to the Code Analysis section where you'll also find useful keyboard shortcuts.
Code inspection
The analysis is performed by applying code inspections to the current document or in any specified scope.

Solution-Wide Analysis
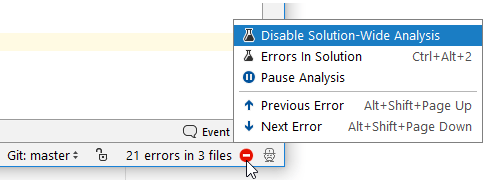
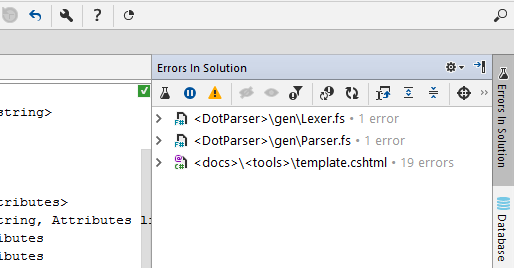
JetBrains Rider not only analyzes errors in the current file, but also inspects the whole solution taking the dependencies between files into account. 

Inspect This
Inspect This is a shortcut to several powerful analysis features that allow you to see how values and method calls flow through your code. The list of available features depends on the current context. 