Automatic inspections
To ease your life, dotMemory automatically checks the snapshot on most common types of memory issues. These inspections could be a great starting point in analyzing a snapshot if you don't know where to begin. To open the Inspections view, click the corresponding tab in the snapshot analysis tab. Along with the automatic inspections, the view provides diagrams that show memory usage and the fragmentation of the managed heap segments.

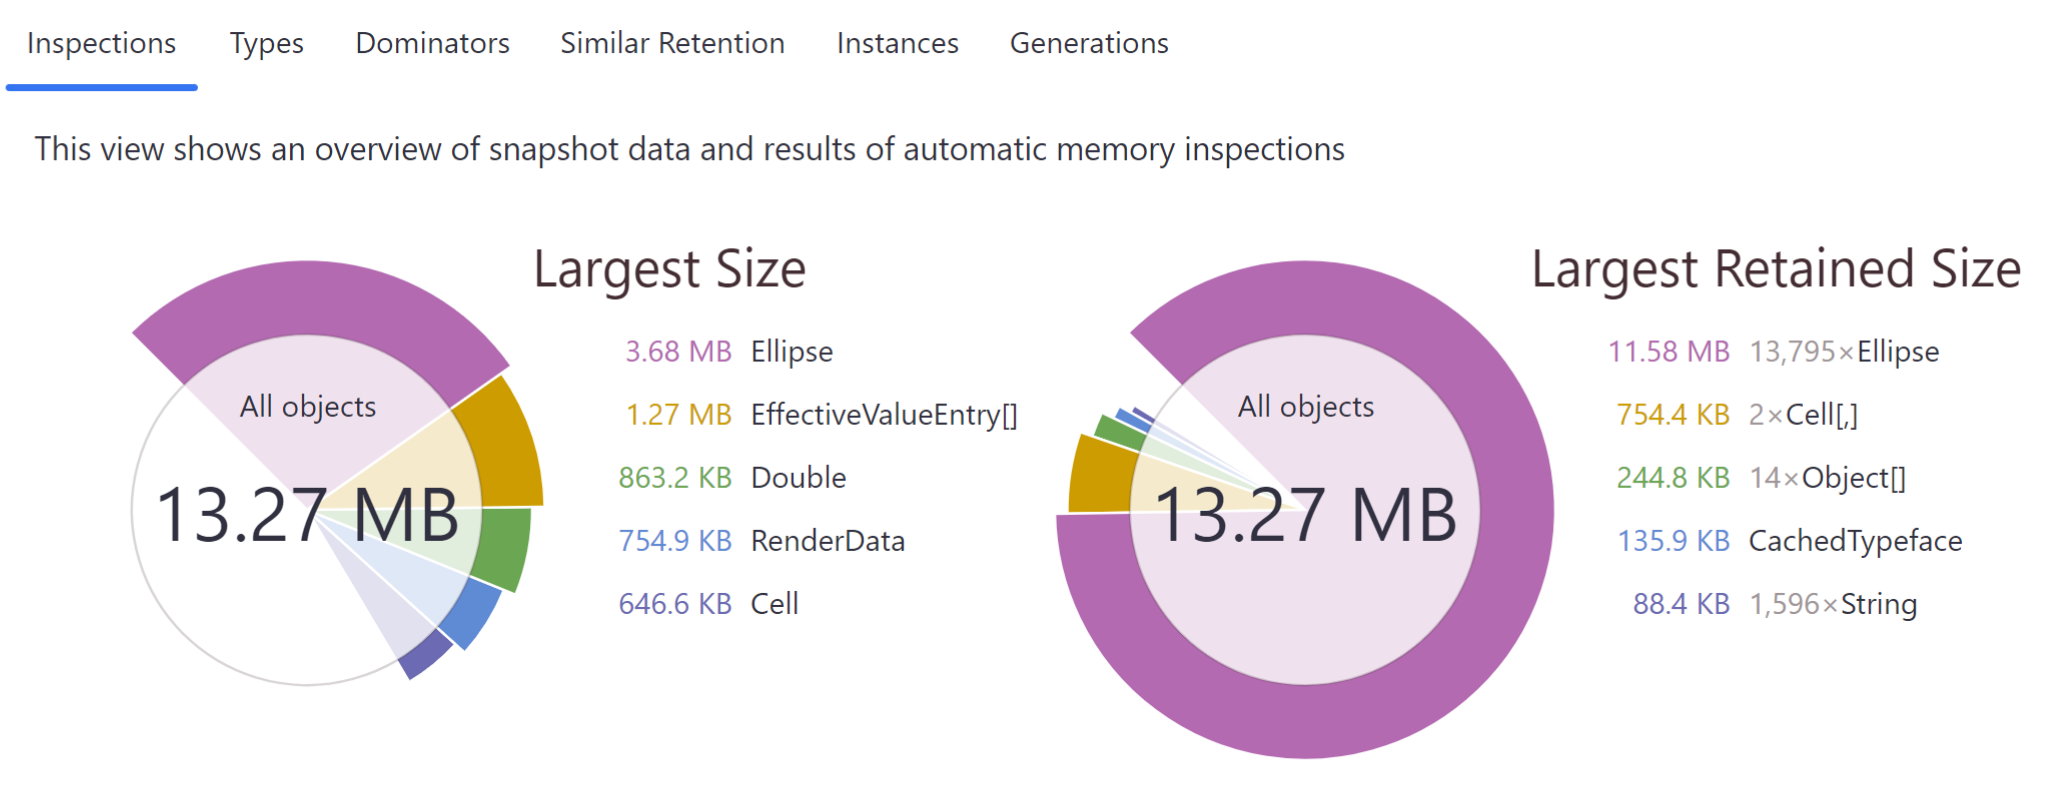
The view provides two diagrams that show memory usage in the snapshot:
Largest Size Diagram
This diagram answers the question "What objects take the major part of memory in my app?" It shows how much memory is occupied by objects of a specific type. Clicking an item on the diagram makes it an analysis subject leading you to the Group by Types view.
Largest Retained Size Diagram
This diagram answers the question "What are the key objects in my application?" It shows the list of dominators – main objects that retain all other app objects in memory. Clicking an item on the diagram makes it an analysis subject leading you to the Group by Dominators view.

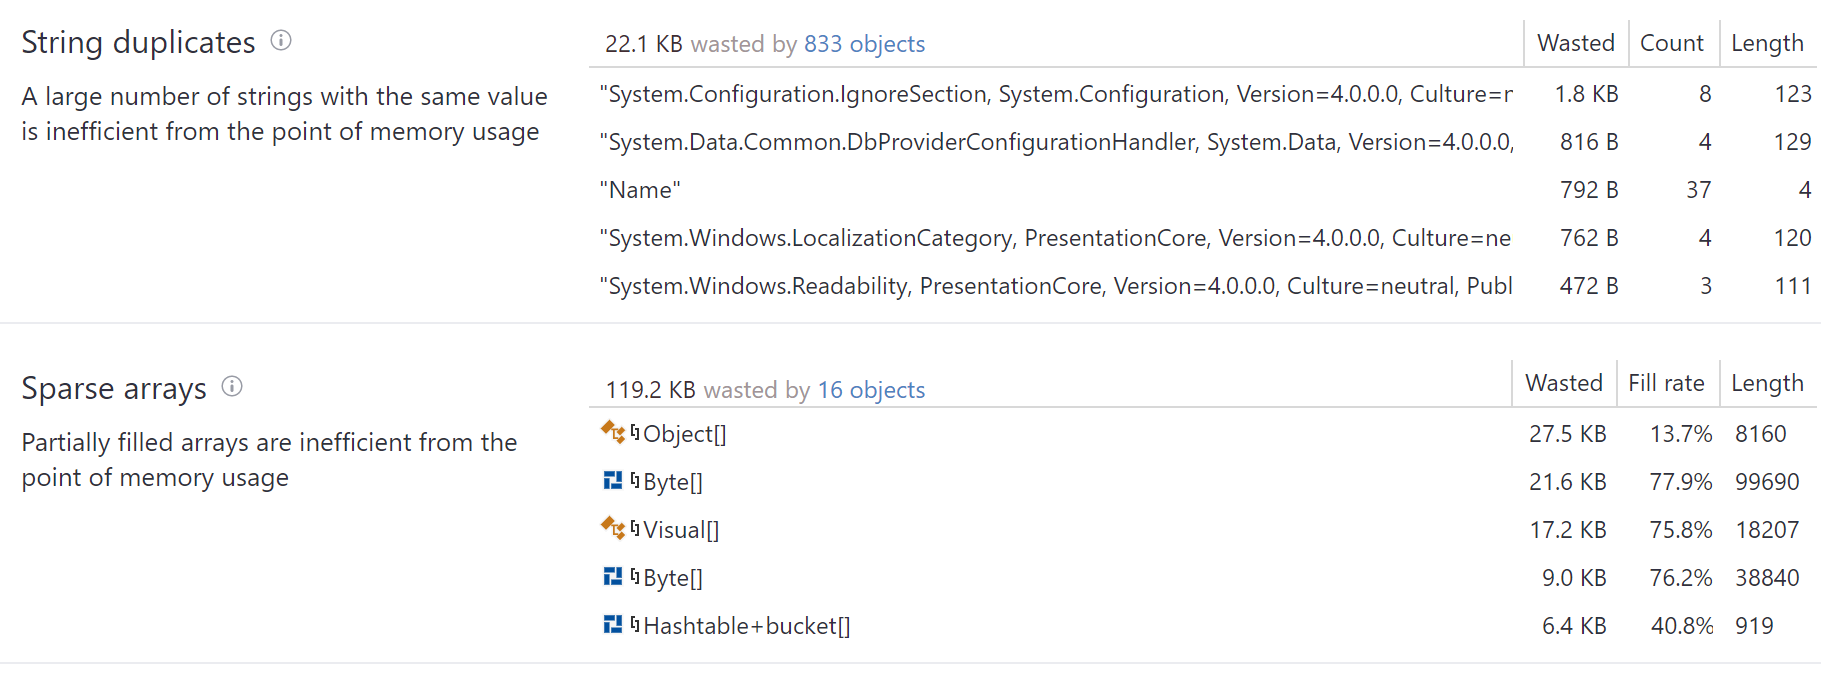
Repeatedly creating strings with the same value instead of reusing the existing one wastes memory. dotMemory detects duplicated strings and shows how much memory is wasted.
Click the link in the inspection header or double-click a particular object set in the list.
If strings with the same value waste a huge amount of memory or generate significant traffic (for example, if your app parses text input) consider implementing string interning.
Sparse arrays are arrays that are mostly filled with zero elements. Sparse arrays are inefficient from the perspective of performance and memory usage. dotMemory automatically finds sparse arrays and shows you how much memory is lost (occupied by zero values) because of them.
Click the link in the inspection header or double-click a particular object in the list.
Finalizable objects are the objects that use the Finalize() method to release unmanaged resources. The problem of using this pattern is, first, that the lifetime of finalizable objects is extended by at least one more GC cycle and, second, that the finalization thread (that executes the Finalize() method) is run unpredictably. This may cause problems in case you want to reclaim the released resources as quickly as possible and may lead to sudden performance drops. dotMemory detects and shows all objects queued for finalization and objects finalized since the previous snapshot.
Implement the
IDisposableinterface for the type that causes issues and release all unmanaged resources via itsDispose()method. For more information about the dispose pattern, refer to Microsoft Learn.
Such a leak occurs when you subscribe an object (let's call it listener) to an event of some other object (let's call it source). For example: Timer1.Tick += OnTimer; During subscription, the source object gets a reference to the event handler of the listener object. If you delete the listener, this reference will prevent it from being garbage collected. dotMemory automatically finds objects that are referenced in event handlers but are never unsubscribed from corresponding events.
Click the link in the inspection header or double-click a particular object in the list.
Unsubscribe the listener from the event when it is no longer needed. For example:
Timer1.Tick -= OnTimer;
Breaking WPF data binding patterns also can cause a memory leak. After you perform data binding to some property of a source object, the binding target object starts to listen for property change notifications. If the property is not a DependencyProperty object and the target object doesn't implement the INotifyPropertyChanged interface, a memory leak in the source object and in every object to which the source object refers may occur. dotMemory detects such binding pattern violations and shows you the list of objects that may potentially cause this leak type.
note
The leak will not take place in case the OneTime binding mode is used to update the target.
Click the link in the inspection header or double-click a particular object in the list.
Make the source object implement the
INotifyPropertyChangedinterface or remove binding when it is no longer needed using theClearBindingmethod.
This leak is similar to the WPF binding leak described above. If there is binding to a collection, that doesn't implement the INotifyCollectionChanged interface, WPF creates a strong reference to this collection. As a result, it stays in memory for the entire application lifetime. dotMemory detects and shows you such objects.
Click the link in the inspection header or double-click a particular object in the list.
Make the source collection implement the
INotifyCollectionChangedinterface. Another way is to use theObservableCollectioncollection as it already implements theINotifyCollectionChangedinterface.
Such leaks occur due to the same reasons as the event handlers leak. Garbage Collector will not collect objects subscribed on DependencyProperty changes through the AddValueChanged method until they're unsubscribed using the RemoveValueChanged method. dotMemory detects and shows you all such objects.
Click the link in the inspection header or double-click a particular object in the list.
When the lifetime of a subscribed object is over, take care of unsubscribing it using the
RemoveValueChangedmethod.
Such leaks take place because of the following WPF peculiarity: WPF creates a strong global reference to the UI element that is declared in XAML and uses the x:Name directive. For example:
<XNameTest:UserControl1 Grid.Row="0" x:Name="myControl1"/>Thus, if you dynamically remove the element declared in such a way, it will still be in memory.
Click the link in the inspection header or double-click a particular object in the list.
One way to remove the leak is to declare the UI element in the C# code instead of XAML. Another way is to call the
UnregisterNamemethod of the parent control when you want to remove the UI element. For example:this.UnregisterName("myControl1");
Use the Heap Fragmentation diagram to evaluate the fragmentation of the managed heap segments:
Generation 1 and 2 heap segments.
Large object heap (LOH) – a separate heap for large objects (85,000 bytes and larger). LOH fragmentation can be a serious issue .
Pinned object heap – a separate heap for objects that are prohibited from moving within the heap. You can open pinned objects as a separate object set.
Frozen object heap (FOH) – a separate heap for immutable objects.
Clicking the diagram header will open the Group by Generations view for all objects in the snapshot.

Heap segment name.
Number of heaps within a segment.
Each bar on the diagram represents a certain heap.
Total heap segment size defined by GC.
The length of bars on the diagram corresponds to the total size of certain heaps within a segment. Note that the total size may be slightly larger than the sum of pinned, unpinned, and free: The total size also includes memory blocks used for alignment, padding, and other specific purposes.
Total size of pinned objects.
Pinned objects are prohibited from moving within the heap. Typically, such objects are used by some unmanaged code or may be a result of using the
fixedstatement.Total size of all objects (excluding pinned objects) allocated in the heap segment.
Total size of free memory in the heap segment.
Heap Fragmentation also lets you open a specific object set – Pinned objects.