Debugging the server- and the client-side code
With JetBrains Rider, you can debug the server-side code of a Node.js application together with its client-side JavaScript code. To do that, you need to create and launch a JavaScript Debug configuration in addition to the Node.js configuration.
With JetBrains Rider, you can create a JavaScript Debug configuration from the Live Edit tab when creating or editing the main Node.js configuration. In this case, the JavaScript Debug configuration will start automatically every time you start the Node.js configuration.
Alternatively, create a JavaScript Debug configuration from the Edit Configurations dialog () and then launch the configurations separately.
Create two run/debug configurations
From the list in the Run widget, select the Node.js run configuration to start together with a JavaScript Debug configuration. Then click
 and select Edit from the menu.
Alternatively, create a new Node.js run configuration, as described in Create a Node.js run/debug configuration.
The dialog that opens shows the settings of the selected Node.js run/debug configuration. Switch to the Browser / Live Edit tab.

In the Browser / Live Edit tab, select After launch to start a browser automatically when you launch a debugging session. In the field below, type the URL address to open the application at.
Choose the browser to use from the list next to the After launch checkbox.
To use the system default browser, select Default.
To use a custom browser, select it from the list. Note that debugging of JavaScript client-side code is only supported in Google Chrome and in other Chromium-based browsers.
To configure browsers, click
 and adjust the settings in the Web Browsers and Preview dialog that opens. For more information, refer to Configure browsers.
Select the With JavaScript debugger checkbox.

Start a session to debug the server and the client code
From the list in the Run widget, select the modified Node.js run configuration and click
 next to it.
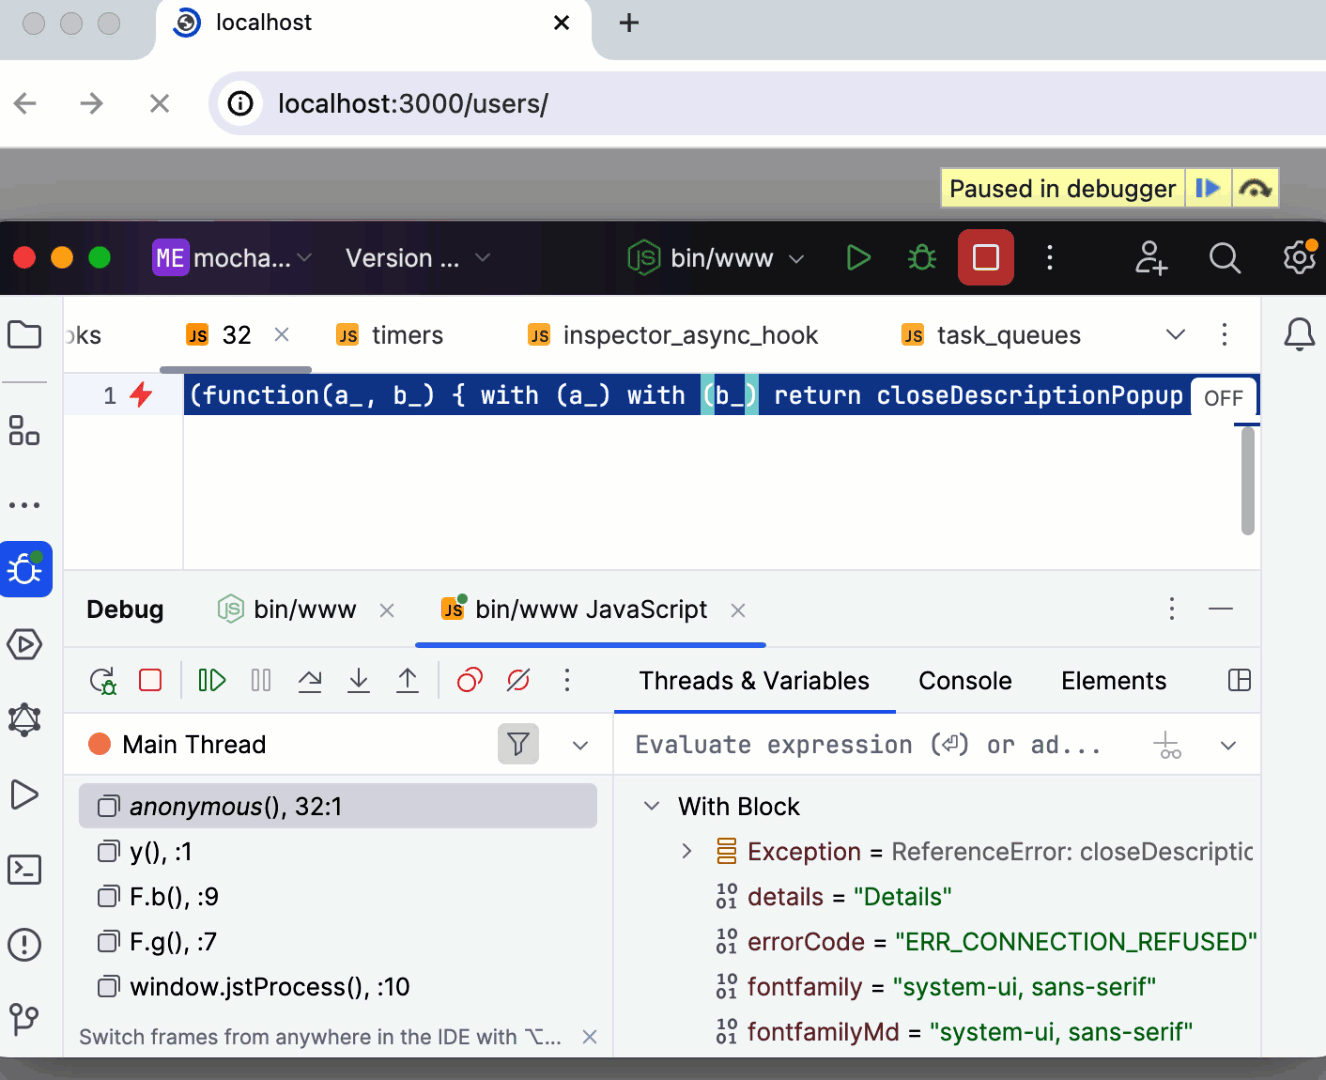
The Debug tool window, that opens, has two tabs - a tab for the Node.js run/debug configuration and a tab for the Javascript Debug run/debug configuration. Which of the tabs is active depends on the location of the first hit breakpoint.

Proceed with the debugging session — step through the breakpoints, switch between frames, change values on-the-fly, examine a suspended program, evaluate expressions, and set watches.
When the browser opens, perform the steps that will trigger the execution of the code. For example, navigate from the starting page of your application to another page in the browser.

When the first breakpoint in the client-side code is hit, the application stops, the page in the browser is reloaded, and the focus in the Debug tool window moves to the tab with the JavaScript Debug configuration.

Continue with the debugging session — step through the breakpoints, switch between frames, change values on-the-fly, examine a suspended program, evaluate expressions, and set watches.