Attach to and profile .NET processes
warning
Attaching to running processes is available with the following limitations:
Windows: Native, .NET Framework 4.0+, .NET Core 3.0+, .NET 5+, Mono 5.10+, Mono Unity 2018.3.
Linux: .NET Core 3.0+, .NET 5+.
macOS: .NET 5+.
dotTrace allows you to profile any .NET/.NET Core process already running in the system. The profiling workflow looks as follows:
Decide which profiling configuration you will use
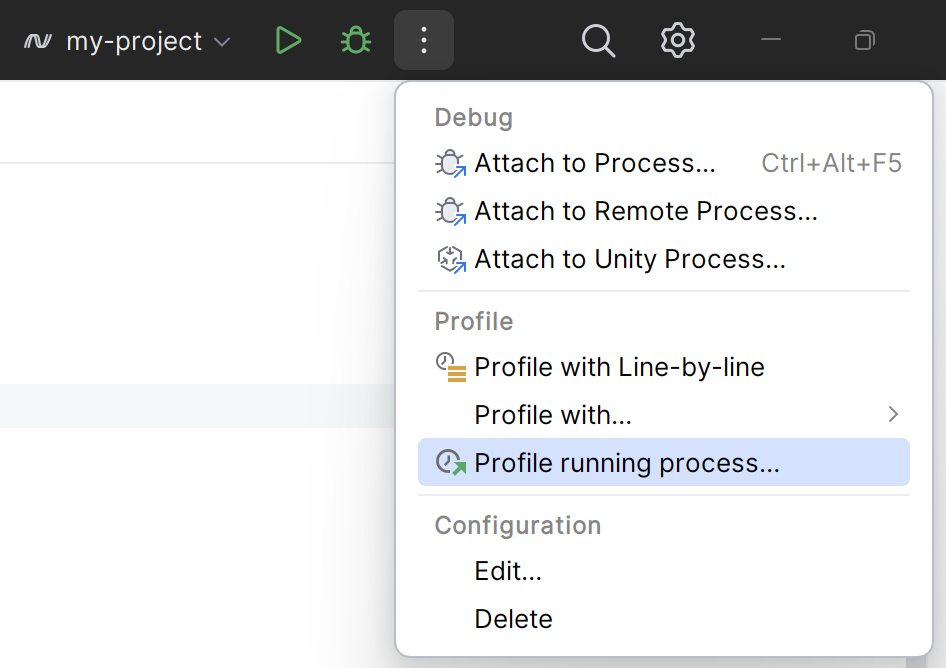
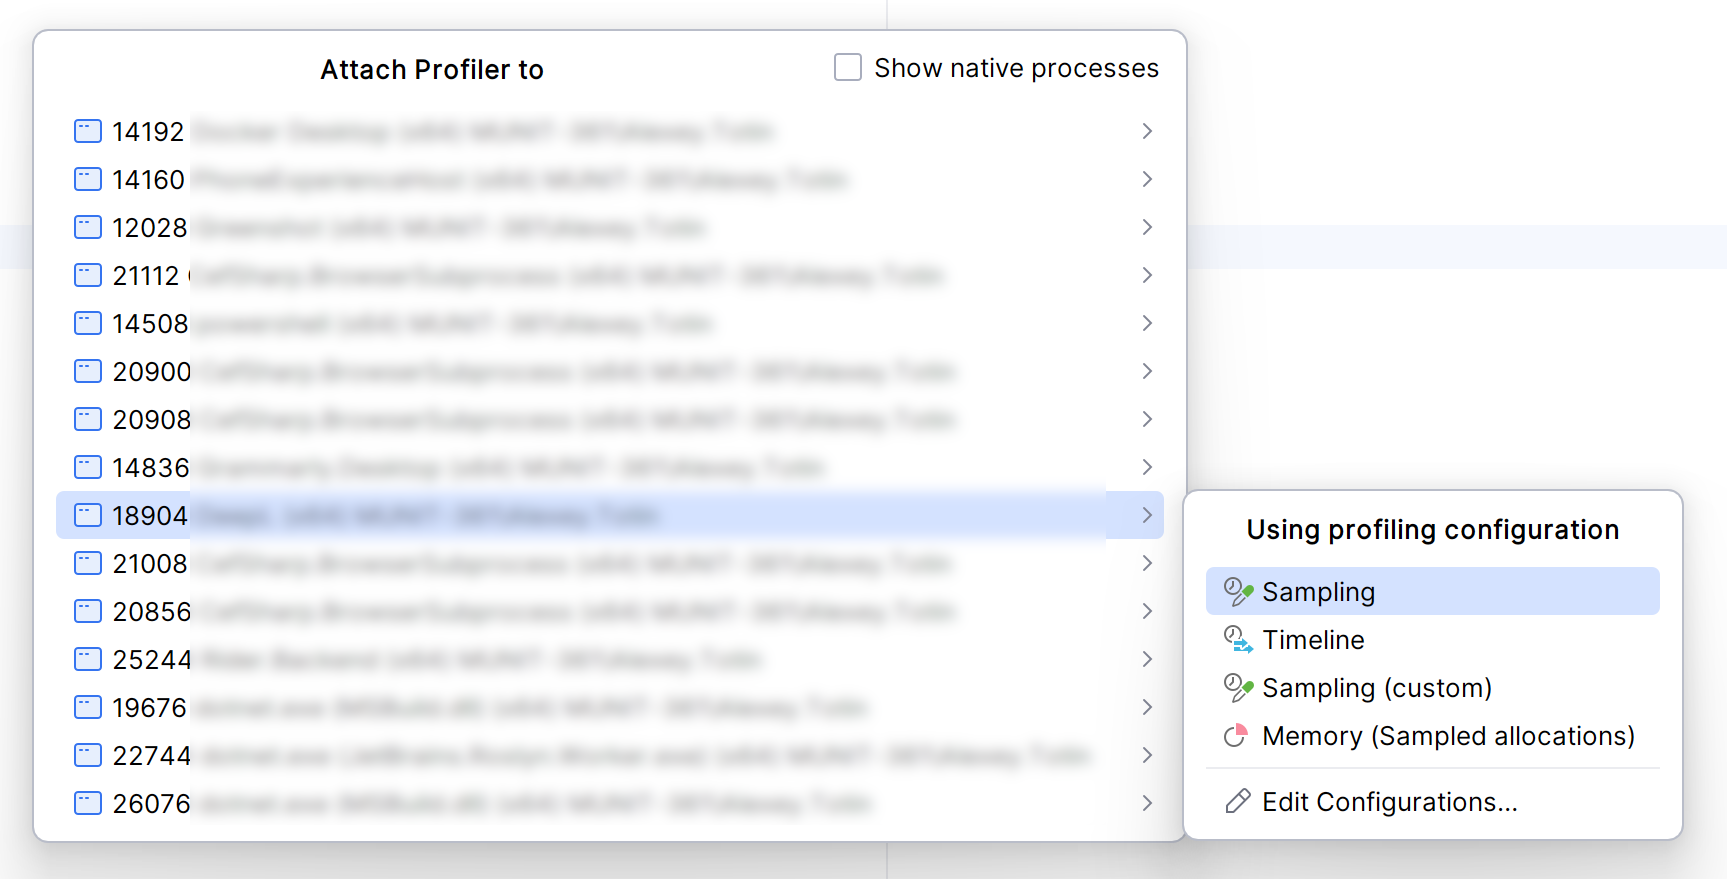
From the menu, choose Run | Profile running process. This will open a list of running processes.

Select a process you want to profile (note that this must be a managed .NET process) and a profiling configuration you want to use:
either one of the predefined configurations: Sampling or Timeline.
or your own custom configuration.
note
When attaching to .NET Core processes, note that only .NET Core 3.0+ or .NET 5+ processes are supported.

Once the profiling is started, you will see the dotTrace Profiler tool window opened on the Profiling tab with the profiling controller inside.
If you disabled Collect profiling data from start in the profiling configuration, click
 Start Recording to start recording profiling data.
Reproduce the performance issue you're looking for or, if you just evaluate the overall app performance, go through the desired usage scenarios in your application.
Click
 Get Snapshot. The collected snapshot will be added to the list of snapshots inside the dotTrace Profiler window. To start collecting profiling data again, click
  Start Recording one more time.
After you collect a snapshot(s), you can finish the profiling session. Normally, you do it either by closing the profiled application or by detaching the profiler via the
 Detach button (
 Kill forcibly terminates the profiled app and the session, so, use it only in emergency cases).
For more information about analyzing performance snapshots, refer to Analyze profiling results.
On the All Snapshots tab of the dotTrace Profiler tool window, select the snapshot you want to analyze.
Analyze the collected data using one of the views:
Call Tree: a "classic" call tree that shows you all method calls in all threads. Each top-level node represents a top-level function which was executed by a certain thread. Use this view to quickly get down to actual application activity. Learn more
Top Methods: the best place to start when analyzing application performance. It is a simple plain list of methods with the highest execution time. Note that you can reduce the system functions "noise" by excluding them from the list using the
 toggle: if enabled, the method's execution time is calculated as a sum of the method's own time and the time of all child system methods (down to the next user method in the stack). Learn more
Once the suspicious method is found, press F4 or select Jump to Source from the context menu. Rider will navigate you right to the method's source code.
Before starting a profiling session, you must decide which profiling configuration you will use. Typically, you decide between
a predefined configuration: Sampling, Timeline.
or your own custom configuration.
The profiling configuration specifies profiling session settings like which profiling type will be used, whether child processes must be profiled, and so on.
The profiling target is a running .NET process you're going to attach to.
From the menu, choose Run | Switch Profiling Configuration | Edit Configurations.
In the opened Profiling Configurations window, click
to add a new profiling configuration.
In the list, select one of the profiling types:
Timeline
Collects temporal data about thread states, application events, and other multi-threading data. On Windows, Timeline profiling is based on Event Tracing for Windows (ETW) and requires running JetBrains ETW Host Service with administrative privileges. On macOS and Linux, external service is not required. Supports native profiling.
Recommended for most cases. Especially for analyzing multithreaded apps. Use it, for example, to determine the cause of UI freezes, excessive garbage collections, uneven workload distribution, insufficient I/O, and so on.
If you want to create a configuration for profiling Mono or Unity applications, select Timeline (Mono) or Timeline (Unity) correspondingly.
Sampling
Accurate time measurement, number of calls is not measured.
Recommended for most cases. Ideal when you look for performance issues in your app for the first time.
On macOS and Linux, if you want to profile an application targeting .NET Core 3.0 or earlier, select Sampling (.NET Core 3.0 or earlier). Note that because of .NET Core limitations, you might have issues: the profiled application may hang or crash. Projects targeting .NET Core 3.1 (or later) can be profiled without any issues.
Tracing
Accurate calls count measurement, time measurement may be inaccurate due to profiling overhead.
When sampling data is not enough. For example, for analyzing algorithm complexity (when info about number of calls is more valuable than call time values).
Line-by-line
Windows only.
Each line of code is measured, call time values are inaccurate due to huge profiler overhead.
For advanced use cases only. For example, when you already know what function causes issues and want to analyze each line of it.
Specify configuration Name and other profiling options:
- Control profiling manually
Enables you to control profiling manually via the profiler controls. For example, to take a snapshot, you will have to click Get Snapshot.
- Collect profiling data from start
If selected, dotTrace will start collecting profiling data right after the launch. Otherwise, dotTrace will start collecting the data only after you click Start Recording in the dotTrace Profiler tool window.
- Control profiling via API
Enables you to control profiling directly from the code of the profiled application. For example, to take a snapshot in the exact point of your code. Learn more about using the API in the dotTrace documentation.
- Profile child processes
If selected, dotTrace will profile not only the main app process but the processes it runs as well.
- Profile .NET 5+ child processes
(Timeline on macOS and Linux)
If selected, dotTrace will profile not only the main app process but the processes it runs as well. Only .NET 5 and later processes are supported.
- Sampling rate
(Timeline on Windows)
dotTrace takes stack trace data from Windows kernel. By default, the kernel provides 1000 sample events per second. You can increase the sampling rate up to 8000 samples/sec. This makes sense, for example, in game development, when you want to profile fast-executing native code. The higher the sampling rate, the more accurate the results are, but the larger the snapshot is.
- Time measurement
(Sampling, Tracing on Windows, Line-by-line)
This option defines how dotTrace must calculate call time. Typically, this is a choice between whether dotTrace should calculate the time when a thread is not working or shouldn't. For more information, refer to dotTrace documentation.
Real time (performance counter)
Recommended. dotTrace calculates the overall real time passed between method entry and exit. This time doesn't depend on app threads states. Time is calculated using system performance counter.
Real time (CPU instruction)
dotTrace calculates the overall real time passed between method entry and exit. This time doesn't depend on app threads states. Time is calculated using the CPU register.
Thread time
dotTrace calculates only the time when a certain thread is running. The time when the thread is waiting or sleeping is not included in the calculation.
Thread cycle time
dotTrace calculates only the time when a certain thread is running. The time when the thread is waiting or sleeping is not included in the calculation. Time is calculated using the CPU register.
- Enable inlining
(Tracing, Line-by-line)
Clear this option if you want dotTrace to turn off JIT-inlining and get call stacks that closely resemble the structure of the application's source code.
- High accuracy
(Tracing, Line-by-line)
If selected, dotTrace will take into account time spent in the profiler itself by taking more time samples.
- Enable native profiling
(Timeline, Unity/Mono on Windows)
If selected, dotTrace will collect native call stack data. The resulting snapshot will contain both managed and native call stacks. This profiling option may be helpful for finding performance issues in Unity games.
- Collect native allocations
(Timeline on Windows)
If selected, dotTrace will collect information about all memory allocations the profiled application does in the native (unmanaged) heap.
Sample allocations every ... KB defines the size of the allocated memory that will trigger a memory allocation sample. The default value is 100 KB. This means that a sample is triggered once the size of allocated memory exceeds 100 KB in total. For example, a native thread allocates five 50 KB memory blocks during profiling. In such a case, dotTrace will detect only two allocations of 100 KB.
The smaller the size, the more accurate the results are and the larger the snapshot is. Use this option to find the optimal balance between the data accuracy and snapshot size.
If Collect only unreleased allocations is selected, dotTrace will save into the snapshot only data about those allocations that were still in the unmanaged heap at the moment of taking the snapshot.
- Collect TPL events
(Timeline)
If selected, profiling performance may be affected, but dotTrace will collect Task Parallel Library (TPL) data. If cleared, there will be no
Tasknodes in Call Tree andasynccall nodes will be shown without their await and continuations parts.Clear this option in case your application does not use multitasking or you do not need this info.
tip
Learn more about how dotTrace works with asynchronous code in the dotTrace documentation.
- Collect debug output
(Timeline on Windows)
If selected, dotTrace will collect information about all messages the profiled application sends to the debug output.
- Download symbol files
(Timeline on Windows)
PDB files (or symbol files) let you see native functions in the call tree. This is relevant for native applications and managed applications that call native code. If you select Download symbol files, JetBrains Rider will try downloading PDB files from remote servers right after you get a snapshot. Note that this may take a significant amount of time depending on file size.
By default, JetBrains Rider looks for PDB files in the locations specified in the
_NT_SYMBOL_PATHenvironment variable. Alternatively, you can specify custom local or remote locations using the configure symbol servers link.If Download in background is enabled, dotTrace starts downloading symbol files while the profiling session is running. This may help to reduce the time of taking a snapshot.