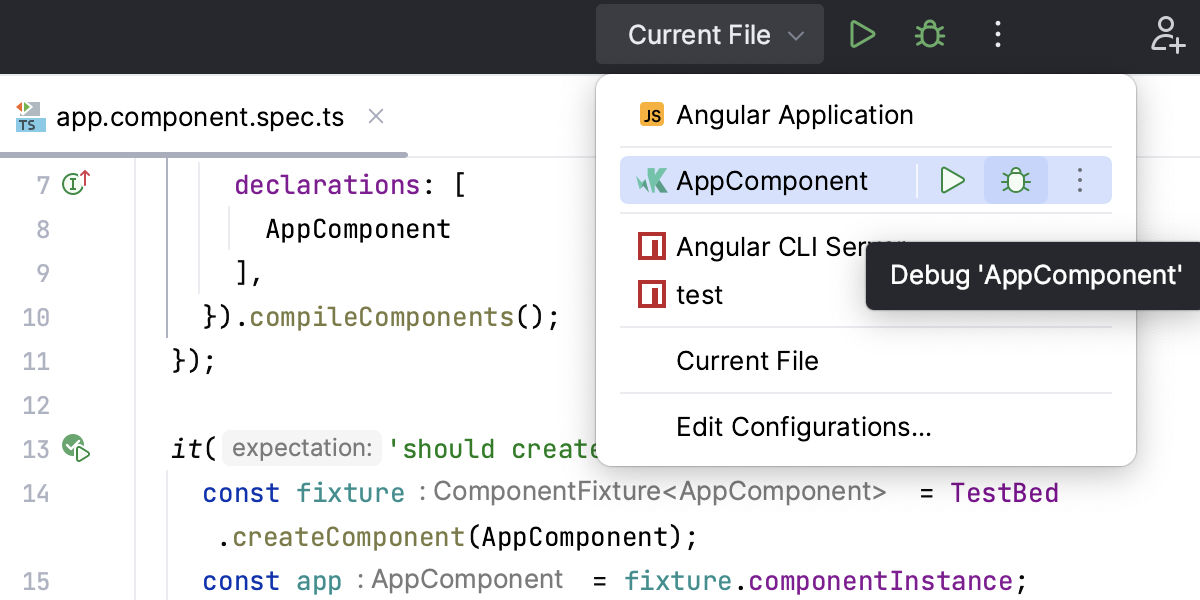
Testing JavaScript
With JetBrains Rider, you can run and debug JavaScript unit tests using Karma, Vitest, Jest, Protractor, Cucumber.js, Mocha and Node.js Test Runner.
You can see the test results in a treeview and easily navigate to the test source from there. Test status is shown next to the test in the editor with an option to quickly run or debug it:
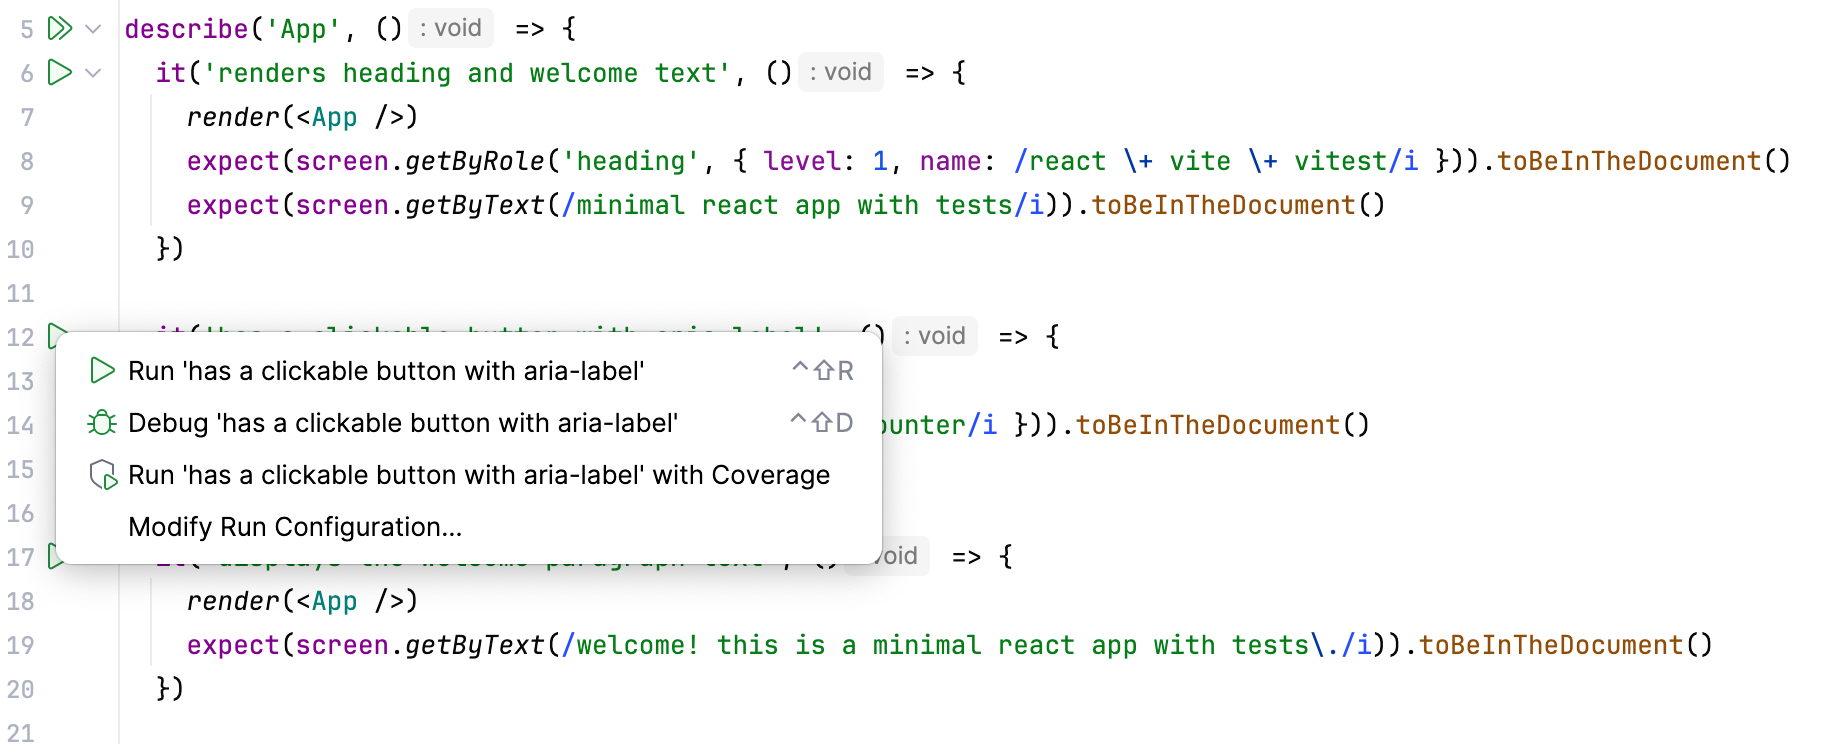
For Jest, Karma, and Mocha you can also see a code coverage report right in JetBrains Rider.
Navigation
JetBrains Rider lets you quickly jump from the source code to the related test file with the Go to test action (Ctrl+Shift+T or ). For example, from auth.js you can jump to auth.test.js.
You can also quickly navigate through a test file using the Structure view that shows the names of the tests and suites, as well as other symbols defined in this file.
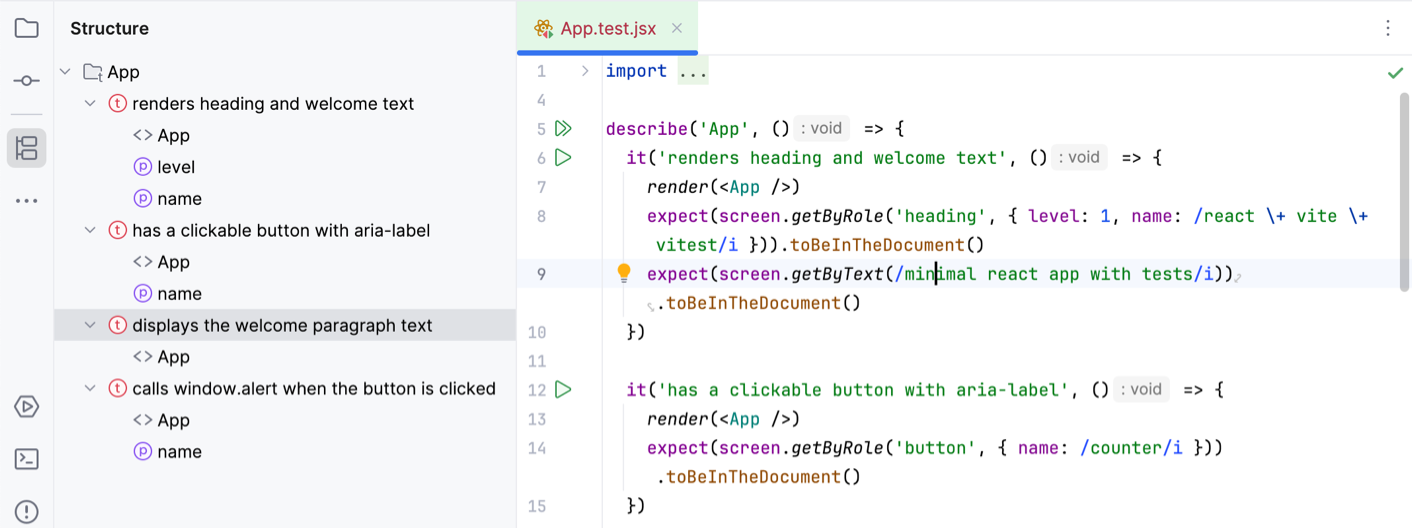
To jump to the Structure tool window, press Alt+7. Alternatively, press Ctrl+F12 to open the Structure view as a popup in the editor.
Run and debug tests
Before you start with testing JavaScript, make sure the chosen test runner is installed and set up in your project as described on the corresponding page.
During a test debugging session, you can step through the tests, stop and resume test execution, examine the test when suspended, run JavaScript code snippets in the Console, and so on.
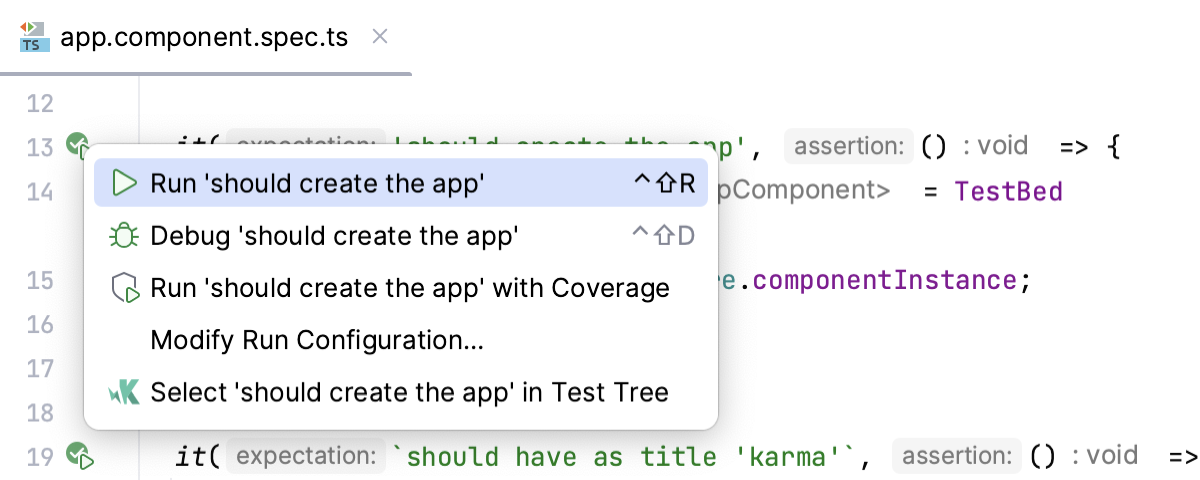
Quickly run or debug a single test with Mocha, Karma, Jest, or Vitest
To run a test, click
or
in the gutter next to it and select Run <test_name> from the list.
To debug a test, set the breakpoints where necessary, click
or
in the gutter next to the test, and select Debug <test_name> from the list.
Create a run/debug configuration
In the Run/Debug Configuration dialog (), click
, and select the appropriate configuration type.
Accept the default settings or fill in the required fields with custom values, see Help for specific test frameworks.
Run or debug tests using a run/debug configuration
To run tests, select the required configuration and click
or
in the list of configurations or on the toolbar.
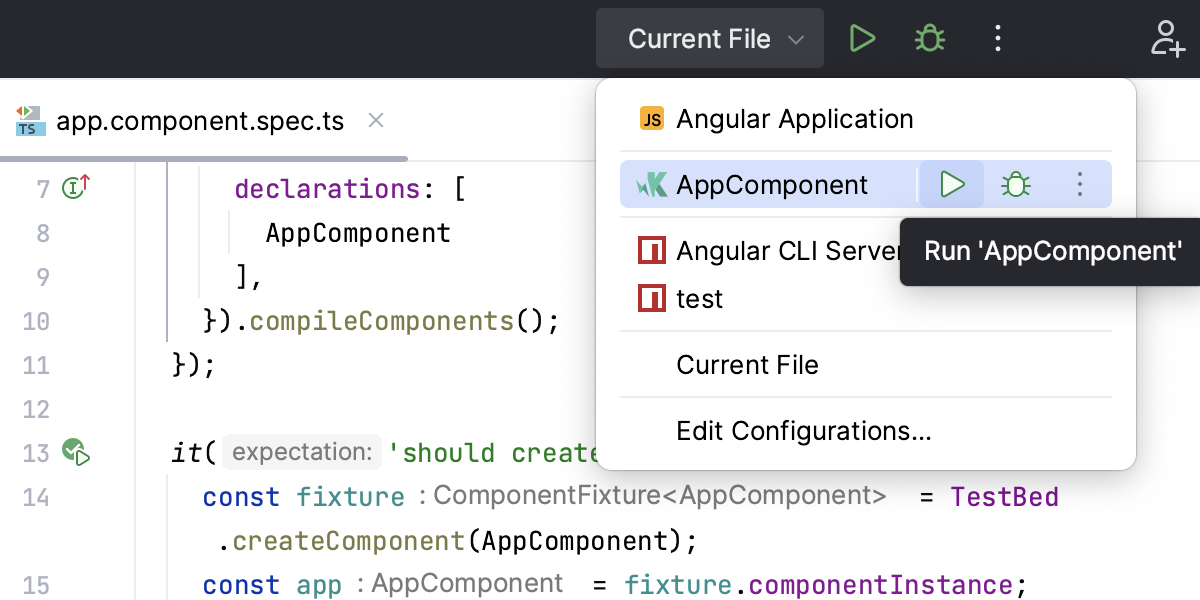
To debug tests, set the breakpoints where necessary, select the required configuration, and click
in the list of configurations or on the toolbar.
