Start the debugger session
RubyMine allows you to debug Ruby scripts, Rails applications, and tests. Starting a debugger session is very similar to running your code. The debugger is attached behind the scenes, so you don't have to configure anything specific to start a debugger session. The topics below describe how to run:
RubyMine allows you to debug code without previous configuring or by using the configured set of startup parameters - run/debug configurations. For instance, you can specify the following parameters for the Rails run/debug configuration: a server type (such as Puma or Passenger), IP address and port, environment (development by default), and so on.
Before debugging
Set breakpoints in the source code.
If necessary, create or modify the corresponding Run/Debug configuration.
Configure the debugger options on the page.
Start debugging
Debug a Ruby script
To debug a specified Ruby script (for example, script.rb), do one of the following:
Press Ctrl twice to invoke the Run Anything popup and type the ruby script.rb command. Then, hold down the Shift key (the dialog title will be changed to Debug) and press Enter.
Right-click a script in the editor or project tool window, and select Debug 'script'.
Debug an application using a specific run/debug configuration
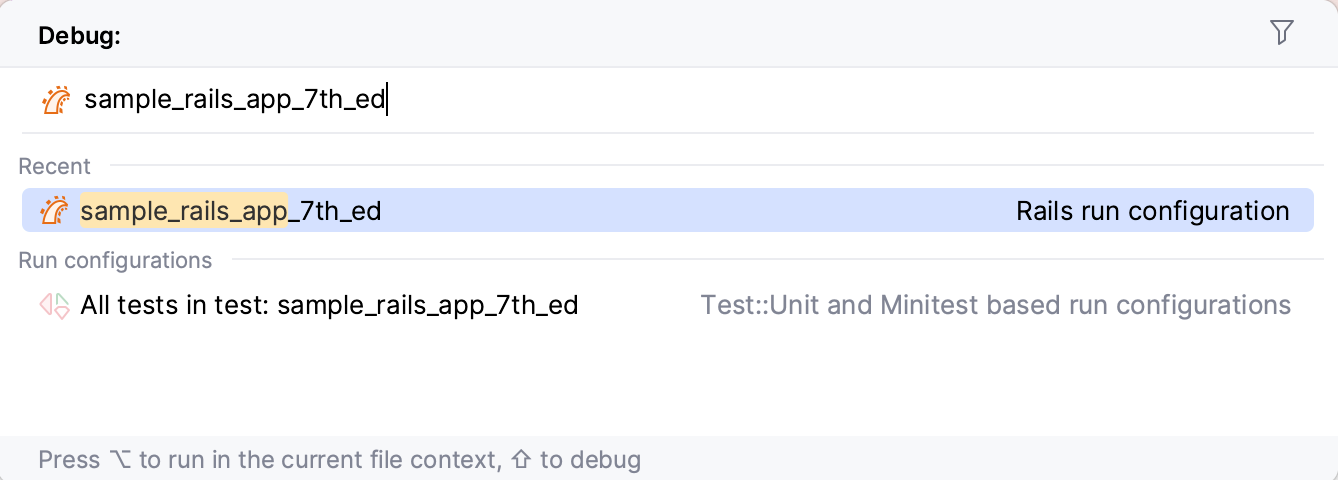
Press Ctrl twice to invoke the Run Anything popup. Start typing the required configuration name and select it from the list. Then, hold down the Shift key (the dialog title will be changed to Debug) and press Enter.

Click the
button on the toolbar to run the currently selected run/debug configuration.

Select the Shift+F9 command from the main menu and select the required configuration.
Debug tests
Learn how to start a debugging session for tests from the Run tests topic.
Pause/Resume a debugger session
When the debugger session is running, you can pause/resume it as required using the buttons on the toolbar of the Debug tool window:
To pause a debugger session, click
.
To resume a debugger session, click
F9.
Restart a debugger session
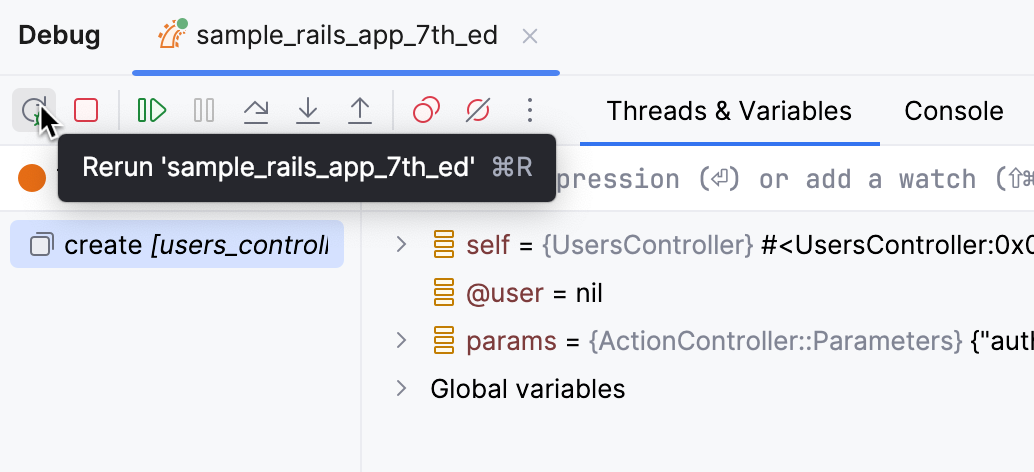
Click the Rerun button in the Debug tool window or press Ctrl+F5.

Locate the process ID (PID) of the debug session
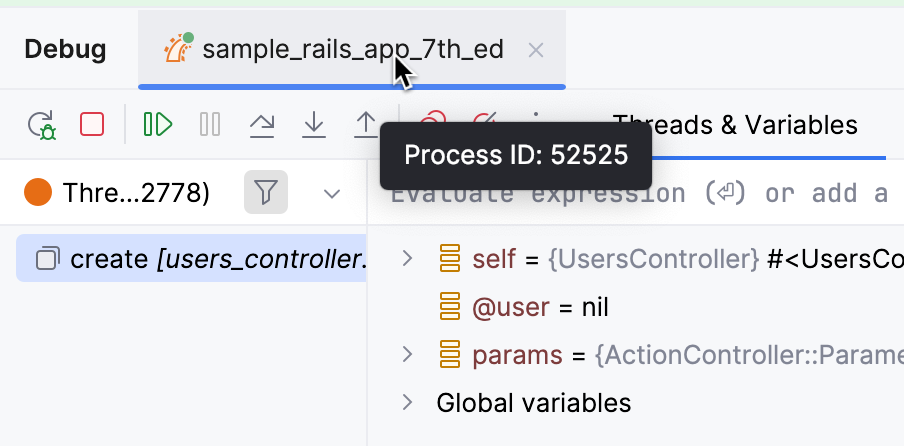
To view the PID of the application you are currently debugging, hover over the corresponding session tab in the Debug tool window.
A tooltip appears that displays the PID of the debug session.

Terminate a debugger session
Click
on the toolbar of the Debug tool window. Alternatively, press Ctrl+F2 and select the process to terminate (if there are two or more of them).