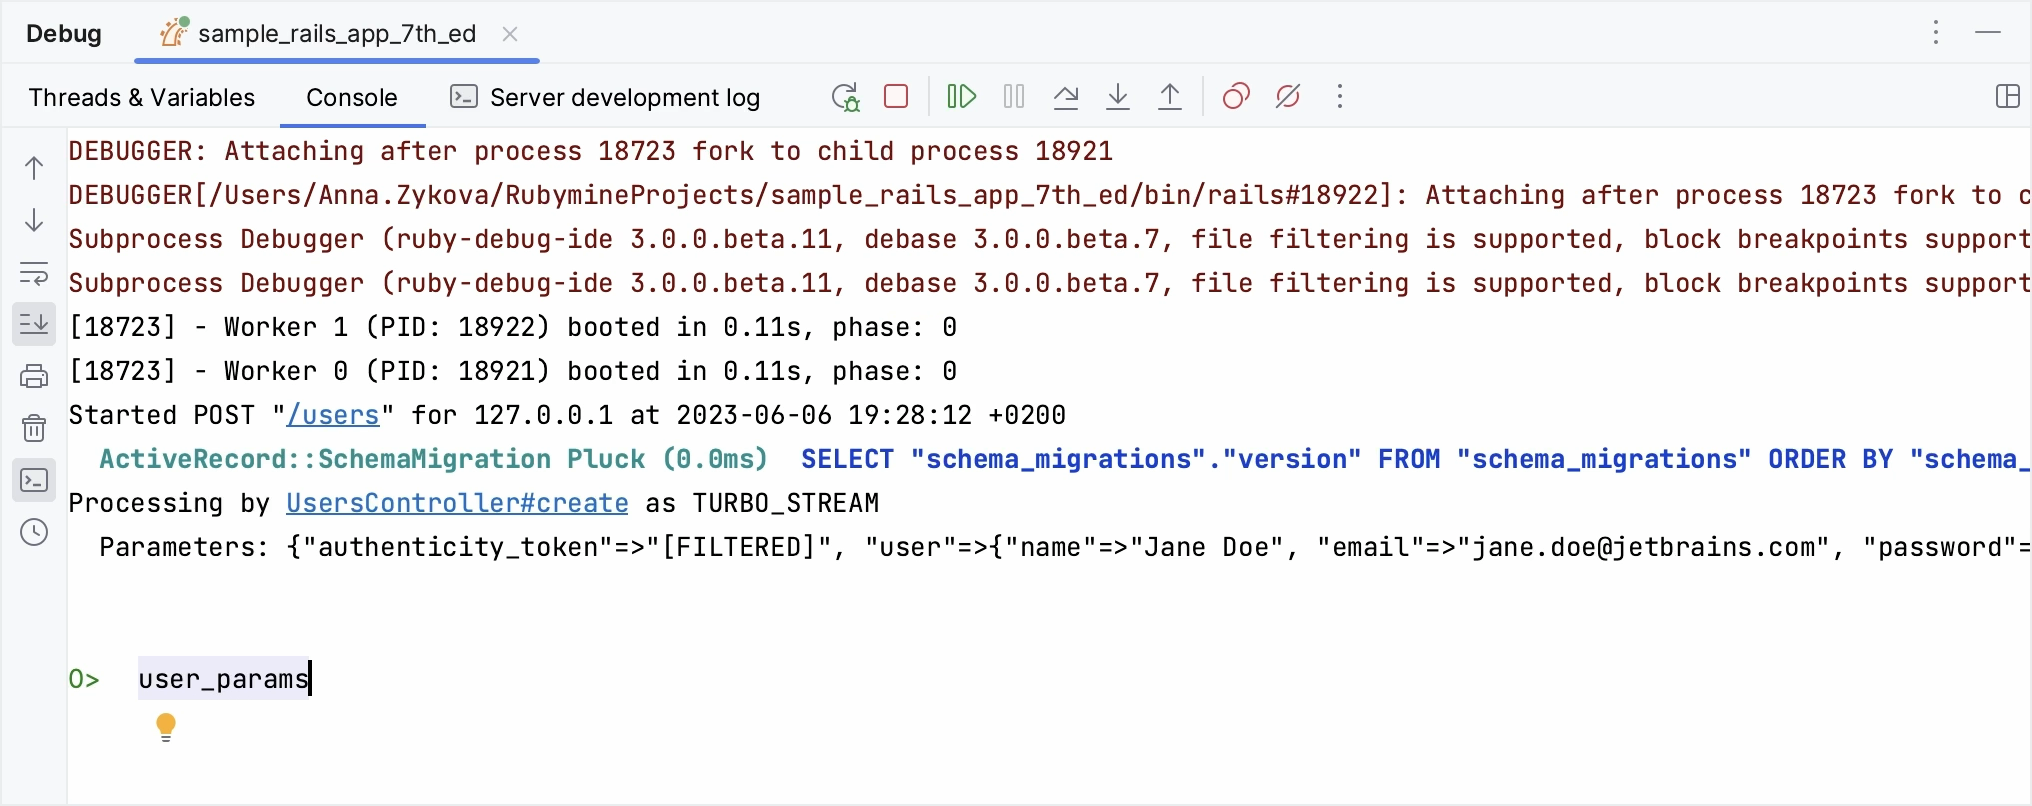
Debug console
When you run the debugging session for a Ruby script, Rails application, or test, RubyMine displays output and error messages in a console. After a breakpoint is hit or the debugging session is paused manually, you can examine a state of the suspended program using an interactive IRB-like console. In this console, you can check variable values, examine complex objects, call methods, and so on.

In this topic, we'll show you how to open and use this console.
Open the interactive console
Depending on a type of the debugging session, RubyMine provides two ways to interact with your application in a console:
If you debug a Ruby script or Rails application, open the Console tab in the Debug tool window and make sure that the
button is pressed.
If you debug tests, Rake tasks, the Console tab is busy with test output. In this case, switch to the Interactive Console tab to interact with your application.
Use the interactive console
You can perform the following actions in a console:
Execute commands
Type commands in the console and press Enter to execute them.
Multiline editing
Type a line of code and press Shift+Enter to move the caret to the next line without executing a command.
Complete names
Use basic code completion Ctrl+Space to complete names of classes, methods, and so on.
Navigate through history
Use the Up and Down arrow keys to scroll through the history of commands and execute the required ones.
Navigate to source code
To navigate to the initial declaration of a symbol and symbol's type, place the caret at the desired symbol and press Ctrl+B.
View quick documentation
To get quick information for any symbol or method signature, place the caret at the desired symbol and press Ctrl+Q.