Run applications
With WebStorm, you can run entire applications, single scripts, or tests right from the editor, using the context menu or gutter icons. If you need to pass some parameters to your application or launch a tool, for example, an npm script, before running, create a language- or framework-specific Run/Debug Configuration and invoke it.
All the run configurations that are currently available in a project are shown in the Select Run/Debug Configuration list.
Learn more from Run/debug configurations.
If you want to see the list of all currently running applications, select from the main menu. For more information, refer to Show running processes.
After a run session starts, the ![]() icon in the Run tool window and in the Run/Debug Configuration Selector toggles to
icon in the Run tool window and in the Run/Debug Configuration Selector toggles to ![]() .
.
Quick way
Run from the editor
If you are not going to pass any parameters to your program, and your program does not require any specific actions to be performed before start, you can run it right from the editor.
To run client-side JavaScript code in the browser, open the HTML page that references it.
WebStorm has a built-in web server that can be used to debug your application in a web browser or preview your code in the WebStorm built-in browser. This server is always running and does not require any manual configuration.
In the editor, open the HTML file with the JavaScript reference, hover over the code to show the browser icons bar:


 , and then click the icon that indicates the desired browser. See Preview output of HTML files.
To run a script, open it in the editor or select it in the Project tool window, and then select Run <script file name> from the context menu.

WebStorm creates a temporary run/debug configuration of the type Node.js.
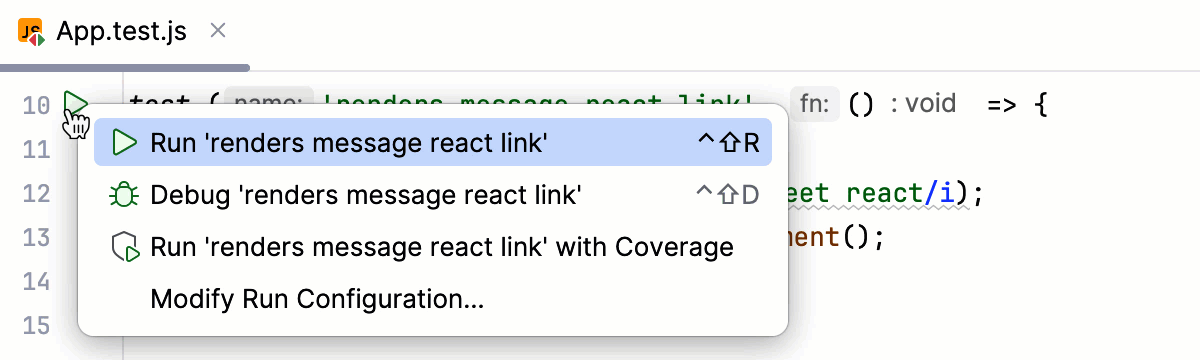
To run a test, click the gutter icon next to it or press Ctrl+Shift+F10. The gutter icon changes depending on the state of your test, refer to Performing tests and framework-specific pages under Testing JavaScript.
To run an npm, Yarn, or pnpm script:
Open package.json, click
 in the gutter next to the script, and choose Run <script_name>, refer to Running and debugging scripts from package.json.
Alternatively:
Use the npm tool window.
Learn more from Running and debugging scripts.
Run the current file
You can run single files using a dedicated option on the toolbar. The run and debug buttons are active and allow you to instantly run the currently opened file.
In the editor, open the file that you want to run.
Click
 next to the Current File option on the toolbar.
You can access the other run modes by expanding the list. From the widget that opens, you can debug the code, run it with coverage, or open the run configuration to specify more options.

Customizable way
Use a run/debug configuration
If you are going to pass parameters to your program, add VM options (for example, to allow remote debugging), or otherwise customize the startup of your program, use a run/debug configuration.
Edit and save a temporary configuration, or create a new run/debug configuration from a template and use one of the following options to run it:
If the run configuration is already selected in the Run widget, click
 next to it or press Shift+F10.
If you want to select another run configuration, click the Run widget. In the menu that opens, click
next to the run configuration you want to launch.
Press Alt+Shift+F10 and select the configuration on the pop-up window that opens.
Click Run from the Run/Debug Configurations dialog.

Launch a run configuration
You can launch existing run configurations in one of the following ways:
If the run configuration is already selected in the Run widget, click
next to it or press Shift+F10.
If you want to select another run configuration, click the Run widget. In the menu that opens, click
next to the run configuration you want to launch.
Press Alt+Shift+F10. In the menu that opens, click the run configuration you want to launch.
When the application starts, you can view its output and interact with it in the Run tool window. Every run/debug configuration creates a separate tab when you run it.

For more information about tool windows and how to manage them, see the Tool windows topic.
Re-run applications
On the toolbar of the Run tool window, click
 or press Shift+F10.
Stop and pause applications
When you stop a program, its process is interrupted and exits immediately. When you pause a program, it continues running in the background, but its output is suspended.
Stop a program
In the Run tool window, click
 on the toolbar. Alternatively, press Ctrl+F2 and select the process to stop.
Pause the program output
Right-click in the Run tool window and select Pause Output from the context menu. Use the same toggle to resume the program.

Show running processes
You can view the list of all active run or debug sessions and navigate between them.
Go to Run | Show Running List. In the top-right corner of the editor, WebStorm shows a list with all active applications.