Gantt Chart
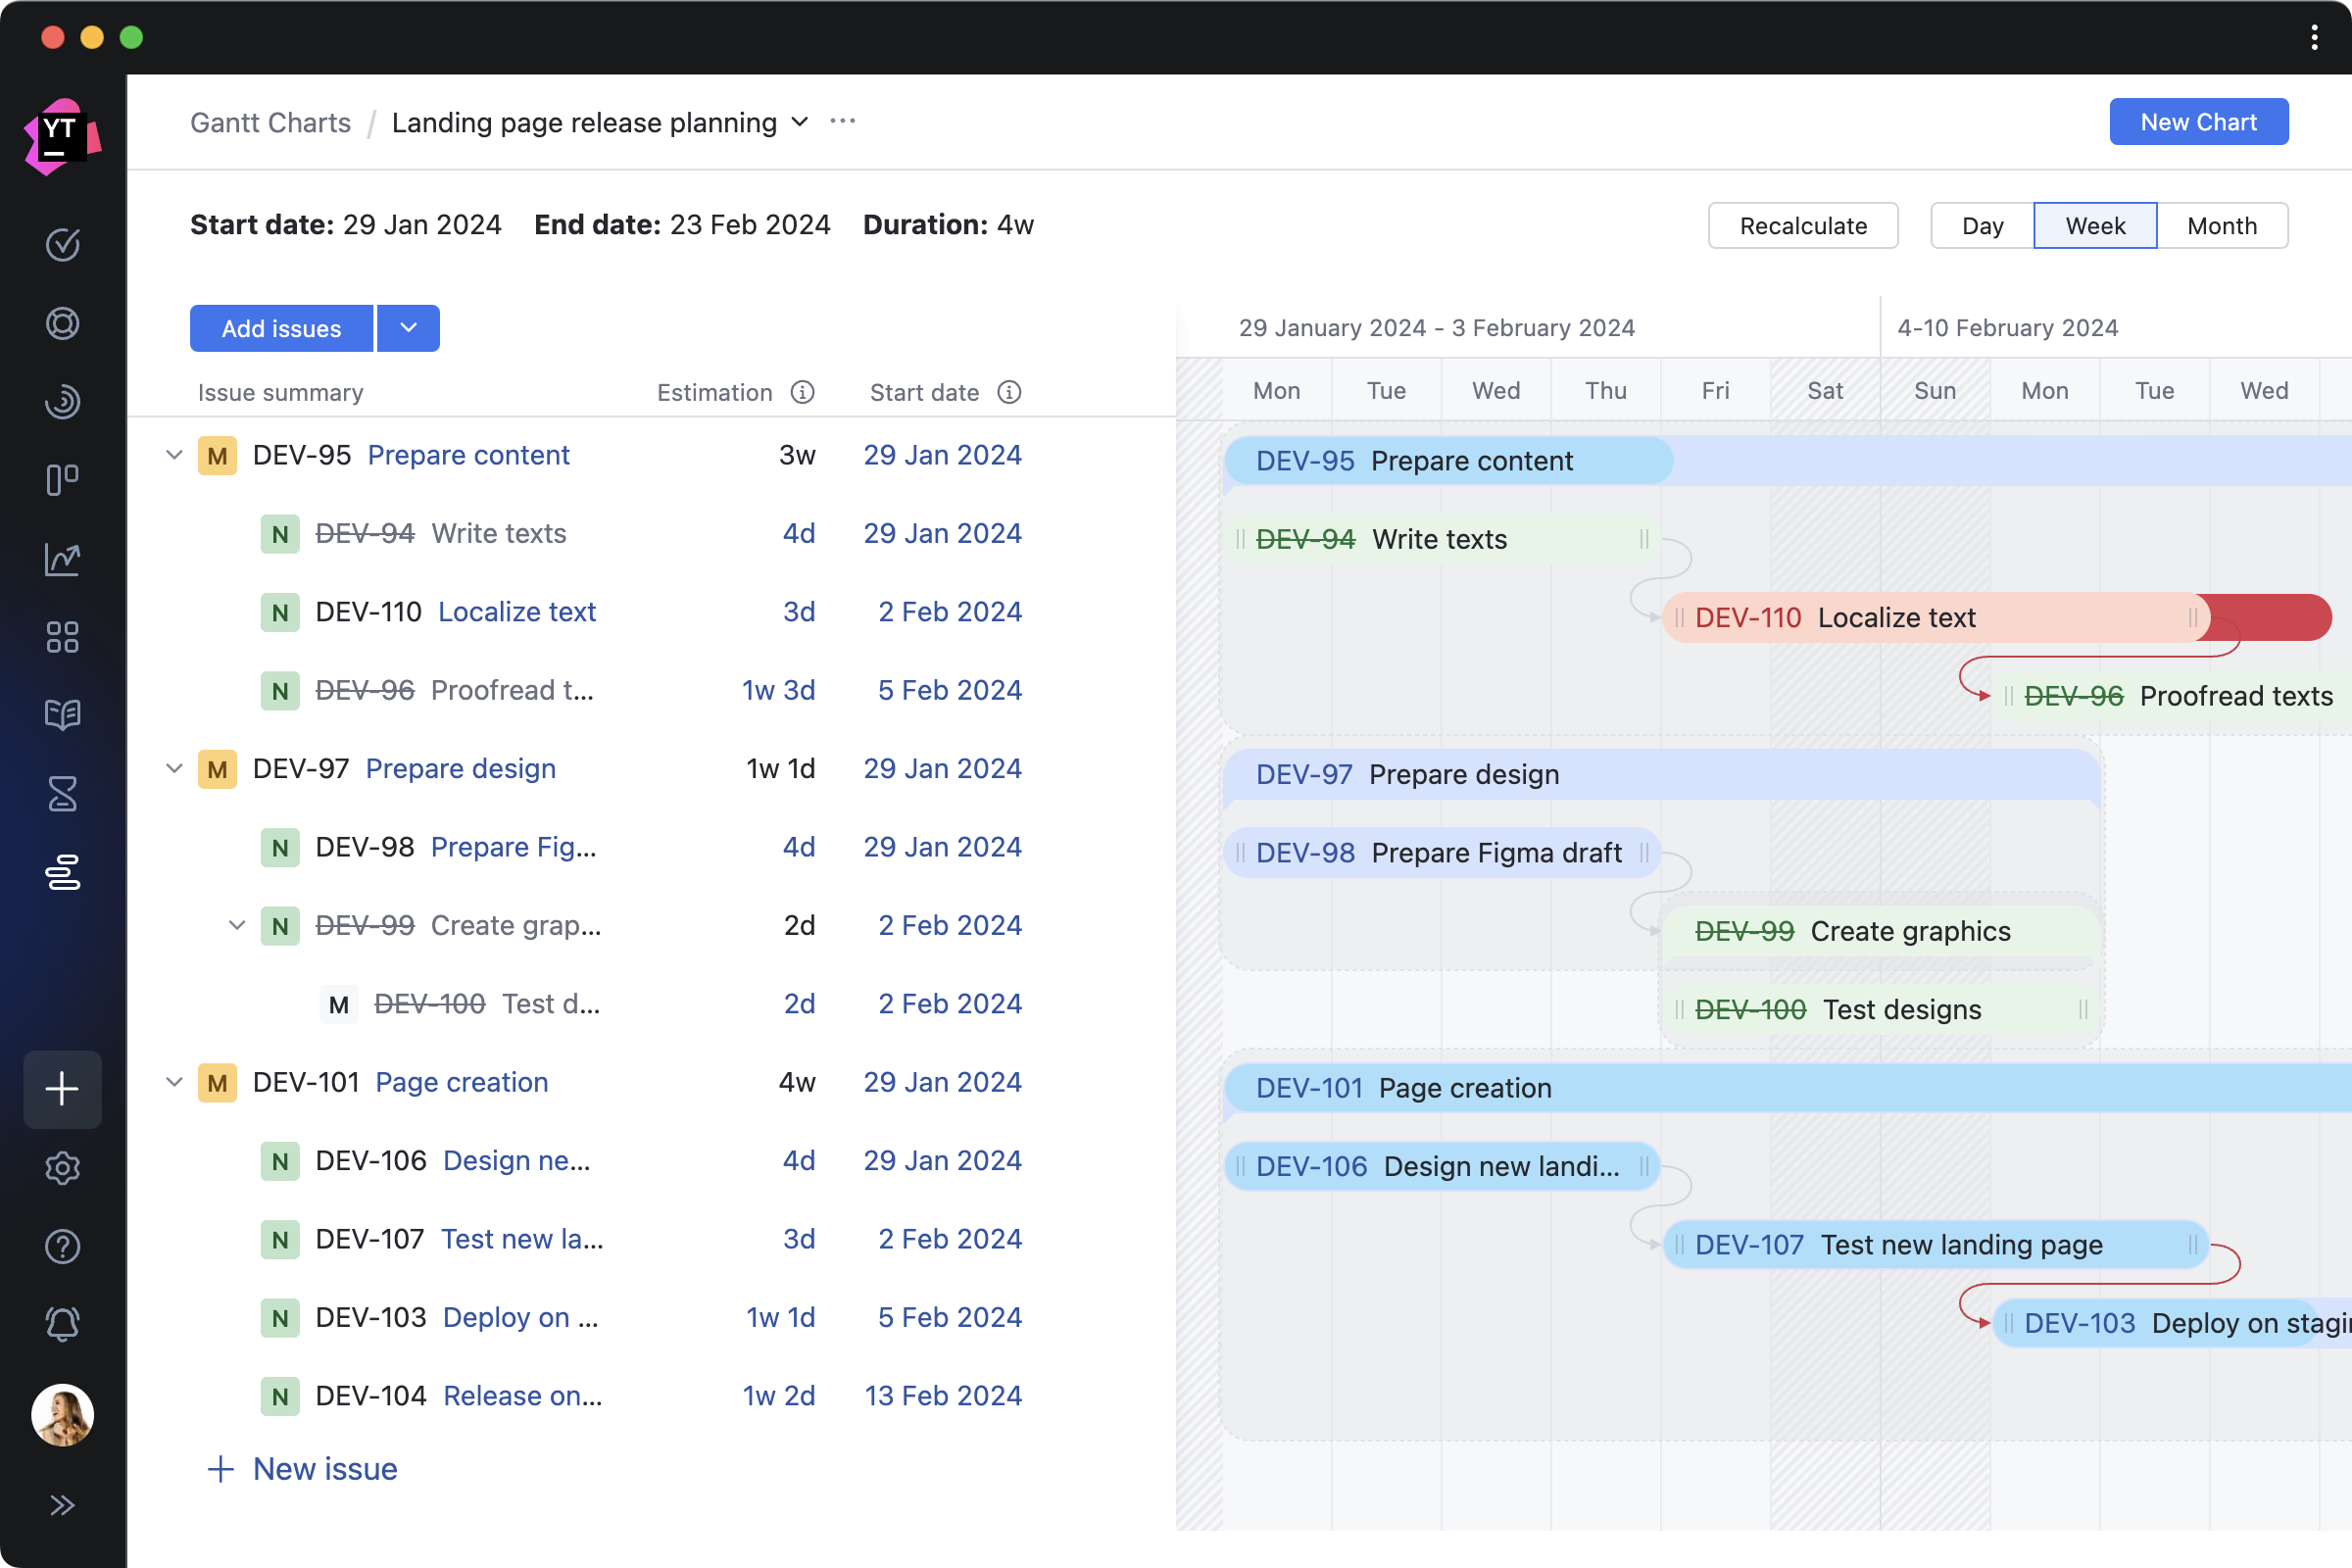
YouTrack’s interactive Gantt chart helps you plan, track, and manage projects effectively and precisely. It provides a clear view of dependencies, and helps you accurately forecast milestones and completion dates based on the estimated volume of work and the resources available in your team.
You can add and create tasks, specify start dates, create dependencies, set estimates, define work in progress constraints, and prioritize tasks directly on the Gantt timeline. Updating estimates and dependencies is easy with the intuitive drag-and-drop interface. Zoom out to see the bigger picture, and zoom in for easy management of fine details.
Learn more about YouTrack’s extensive planning, tracking, and reporting capabilities, and try it for yourself with a free version.
Free for teams of 10, forever
Planning and forecasting
Specify the tasks to be completed and get a detailed forecast of project flow and completion dates.
Identify and deal with bottlenecks and critical issues before they become a problem.
Tracking and reporting
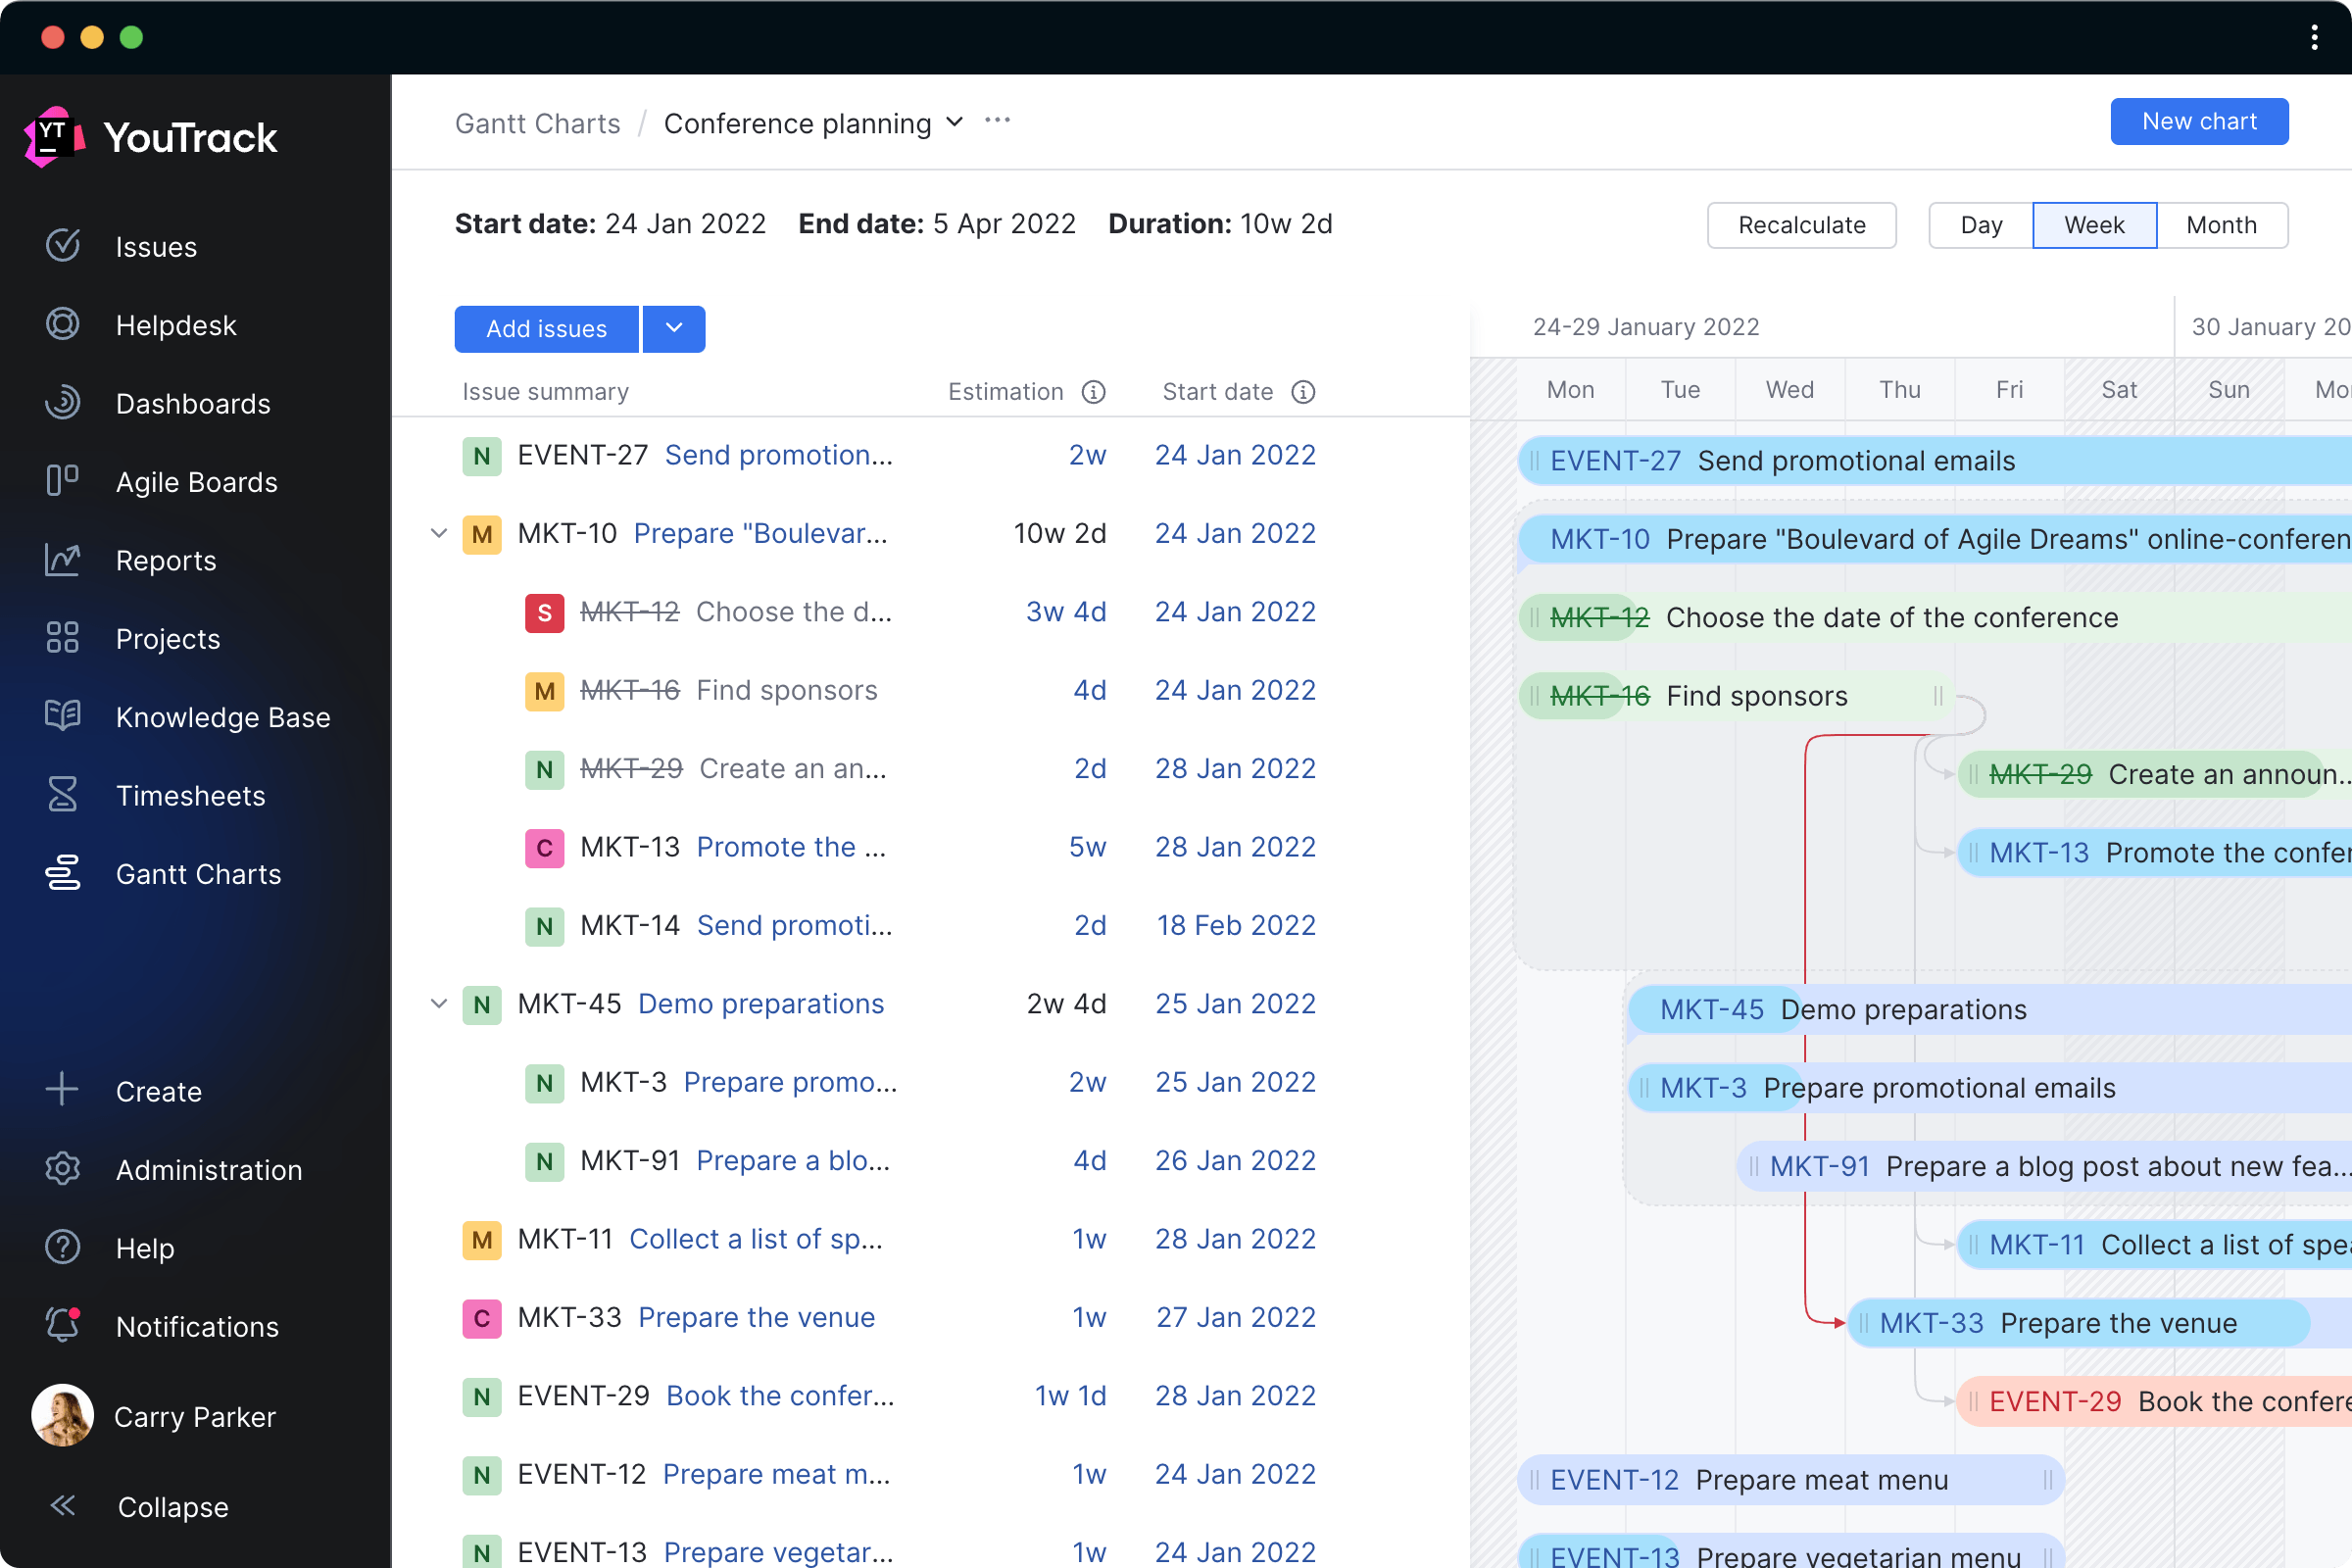
The Gantt chart displays progress on individual tasks, with aggregation up through parent tasks to give a clear view of the overall state of your projects.
Clear visualization of progress and dependencies makes it easy to identify problematic issues that are taking too much time and blocking progress on other tasks. One-click recalculation updates the timeline to account for overdue tasks.