Core dump debug
CLion supports postmortem debug with core dump (macOS, Linux) and minidump (Windows) files. These files are copies of process memory captured by the system at the point the program crashed or otherwise terminated abnormally.
Since the only available data is a memory snapshot for the time of a crash, stepping through the program is not possible, but you can investigate the corresponding source code, frames, and variables. Memory view, disassembly view, and debugger console can be used as well.
Configure a core dump debug session
Use one of the options:
Select from the main menu or call this action from (Ctrl+Shift+A).
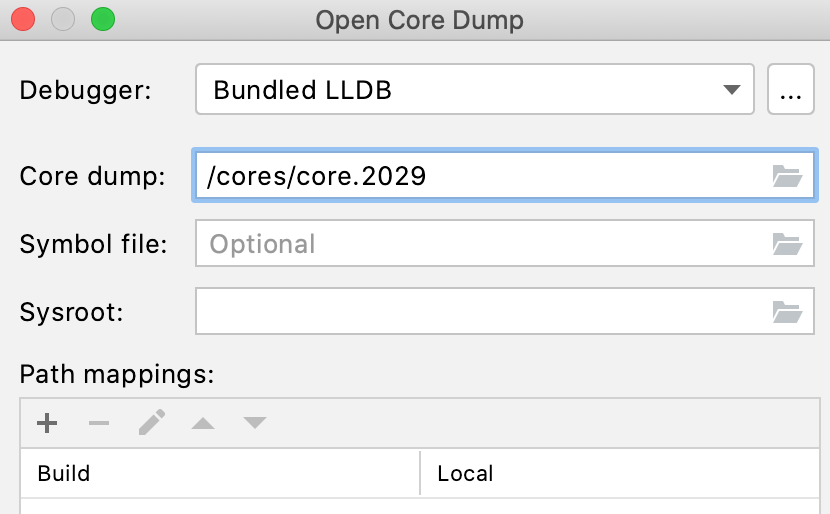
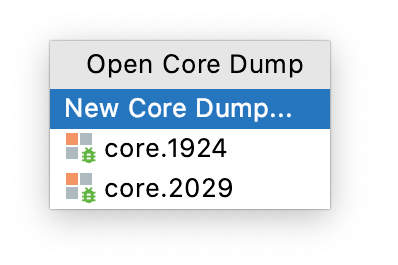
If there are no Core Dump Debug configurations in the project, the Open Core Dump dialog will be shown right away. Otherwise, select New Core Dump from the popup menu.

Follow the instructions in step 2.
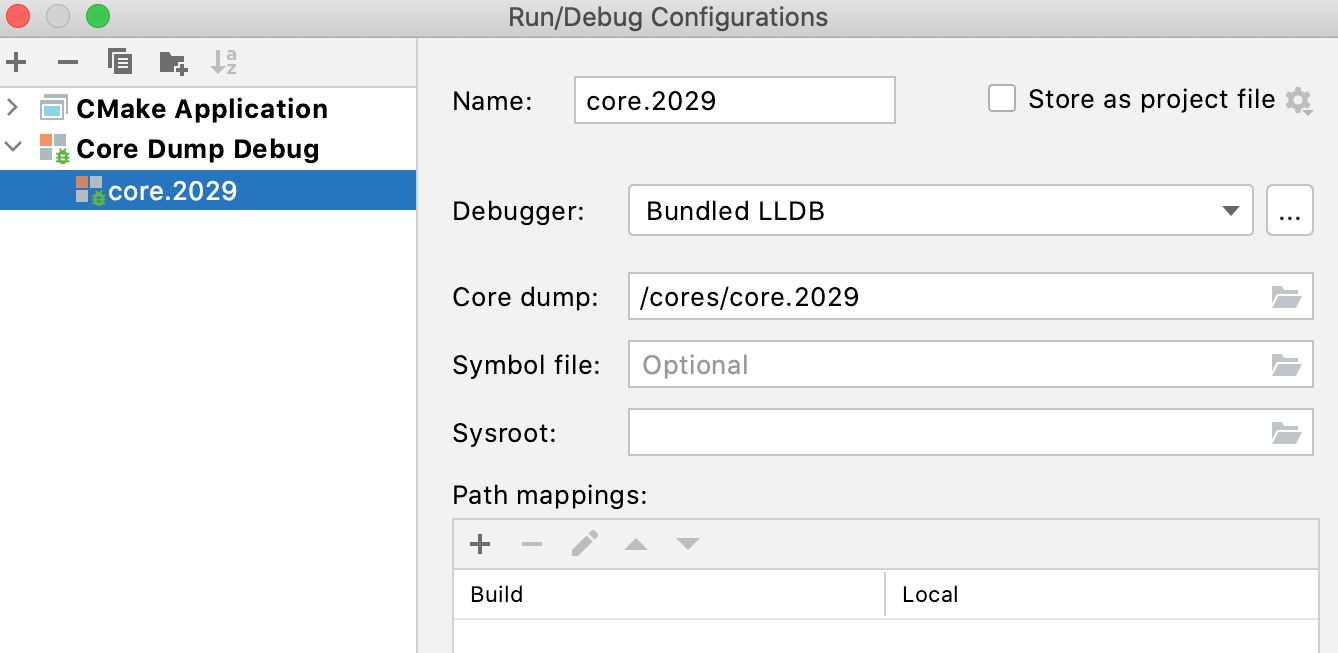
Create a Core Dump Debug configuration manually. Go to Run | Edit Configurations, click
, and select Core Dump Debug from the list of templates.

Configure the following settings:
Debugger
Select the debugger to be used: bundled LLDB, bundled GDB, toolchain's GDB, or a custom external GDB.
Default debuggers are the bundled LLDB if the default toolchain is configured with LLDB, and the bundled GDB in all other cases.
Core dump
Provide the path to the core dump file or select it using the file chooser. Make sure the file has read access permission.
Symbol file (optional for LLDB, required for GDB)
Symbol file is required for CLion to identify the program symbols correctly and navigate you to the proper source code locations. This can be a program's binary build with debug information or a separate symbol file.
Note that symbols from the linked libraries built without debug info will be available only if related debug symbols are located in default search directories.
LLDB can detect the binary that corresponds to the selected core dump.
However, if the crash you investigate happened in a binary without debug symbols, you need to provide them to LLDB explicitly. For this, specify the path to a non-stripped version of the binary or a separate symbol file.
For GDB, it's required that you specify a non-stripped binary or a separate symbol file manually.
Sysroot
Specify the
sysrootpath if you are debugging a core dump from the binary build on another system with libraries in a non-default location.Path mappings
Use this pane to set path mappings if the binary was built on another machine with different file/directory names or paths.
Launch a core dump session
For the Open Core Dump action, CLion creates the corresponding configuration and launches it automatically.
If you call Open Core Dump when there are existing configurations in the project, it will open the list of them with the option to create a new one:

If you created a Core Dump Debug configuration manually, select it in the switcher and press
(Shift+F9).
Core dump debug process
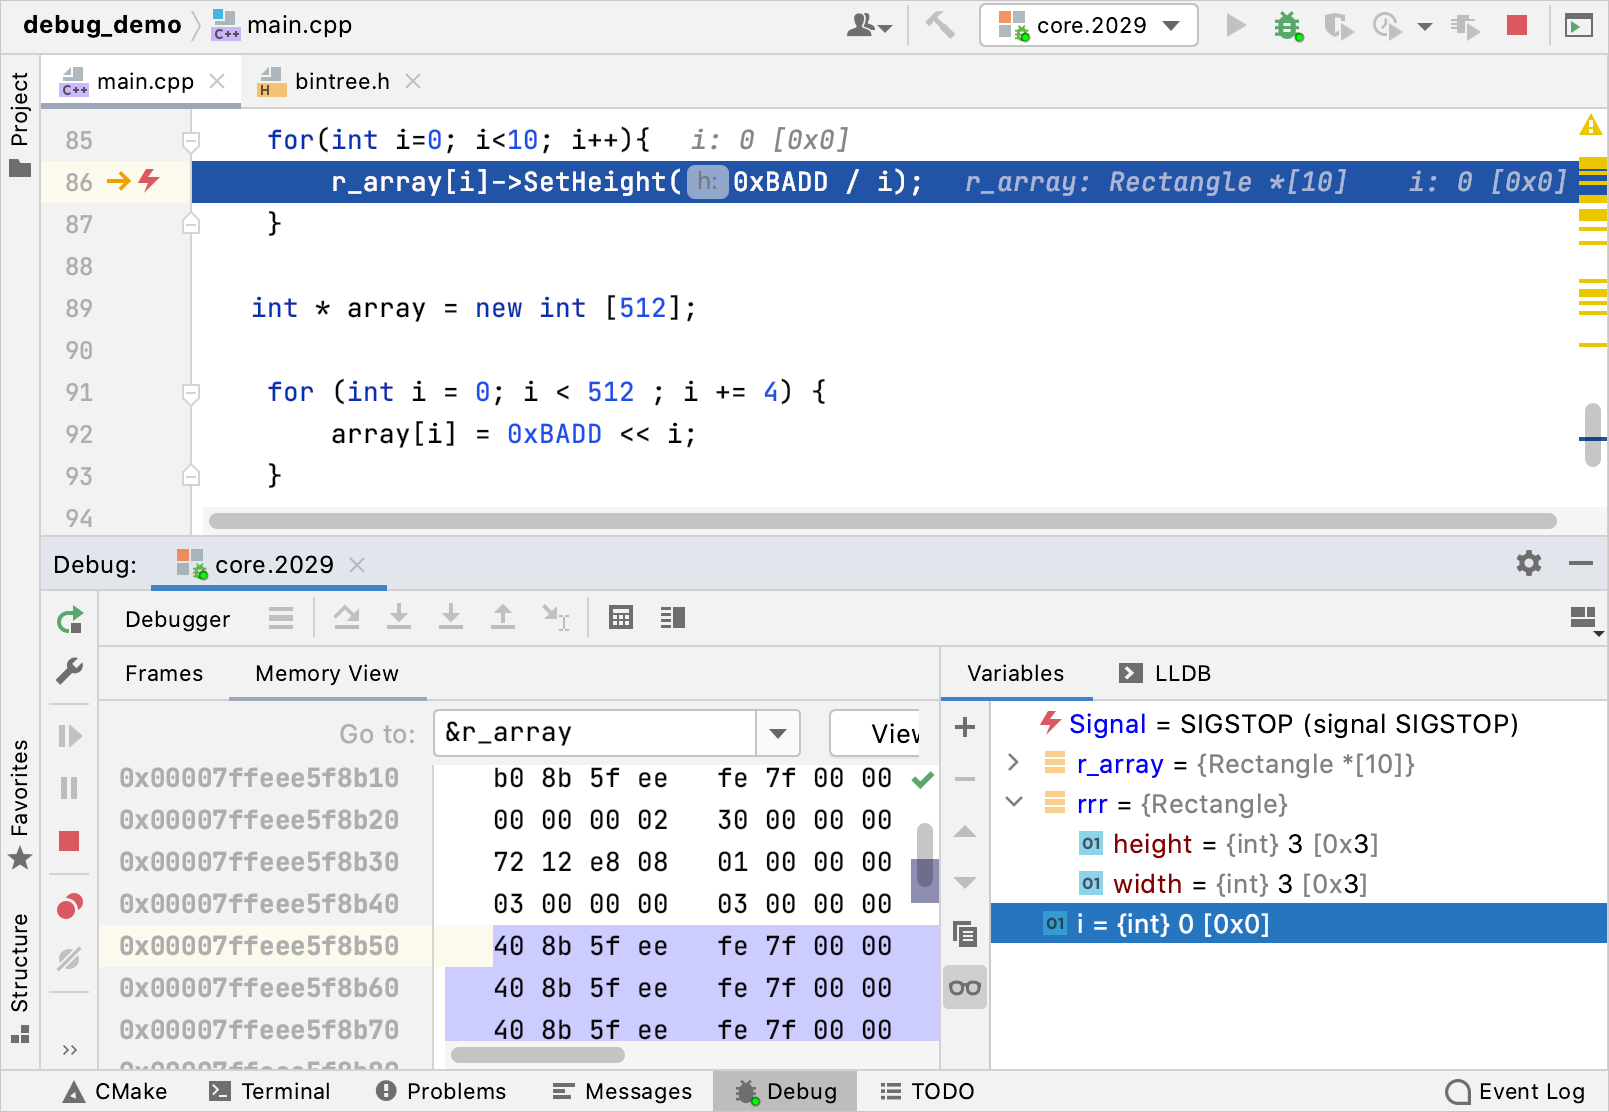
When you start a core dump debug session, CLion opens the corresponding source code and the Debug tool window automatically. Similarly to a regular debug session, you can use the Frames tab and the Variables pane, as well as Memory and Disassembly view. Debugger console for running debugger commands is also available.

Current issues and limitations
Remote core dump debugging is currently in development (CPP-22656, CPP-24333).
On macOS, bundled GDB might fail to start with the No core file handler recognizes format error, which is a known issue with GDB on macOS.
Evaluate expression functionality can be limited.