Build a report
Publish your notebooks as static or interactive reports to present your work focusing on its outputs, such as data visualizations and descriptive or explanatory texts.
As opposed to shared notebooks, reports are HTML pages with ready-made applications that can be used by a wide variety of viewers who are more interested in the output than the input of the respective notebook and may not even have a Datalore account.
This topic describes the process of preparing your report using the Report builder. With this tool, you can set up the layout and content of your report by setting up the following:
- Cell visibility
By default, all the cells of the notebook with both inputs (for code) and outputs are set to be visible in the report that you are preparing. However, you can select which of the cells or their inputs or outputs to show or not to show in the report.
note
By changing cell visibility, you do not affect the structure, computations, or performance of the notebook. Regardless of how you set up cell visibility, the notebook is published in its entirety; you only manage how individual cells are displayed in the report.
- Cell dimensions
By default, the cells you select to show in the report inherit the dimensions they have in the notebook. You can edit cell size by dragging cell borders, selecting width presets, or enabling dynamic height (to adjust to output).
note
Cell size manipulations do not affect how the respective cells look in the notebook.
Open the notebook you want to publish.
Open the Report builder in one of the two ways:
Click the Build report button in the upper right corner of the editor screen.
Select Main menu | File | Build report.
The Report builder interface consists of the following components:
Cell list: The left-hand sidebar that contains miniature representations of all the cells in the same order they are arranged in the notebook. For each code cell, there can be a separate card-like representation of its input and output. The cells are numbered based on the cell sequence in the notebook.
tip
Switch between the worksheets by clicking their titles on top of the list to quickly navigate to the respective cells.
Canvas: The grid area where you set up the layout of the report by re-arranging and resizing the cell inputs and outputs you selected to make visible. On the canvas, you see approximation of what your report will look like when published. By default, when you open the notebook in the Report builder for the first time, the Canvas contains all the cells.
Tabs: The sections within a report that allow you to organize content into multiple views. Tabs help structure complex reports by grouping related information, similar to sheets in Excel or pages in Power BI. You can add tabs and assign selected cells and outputs to one or more of them. Each element can only appear in one tab at a time. Report viewers can navigate through the report using these tabs for a more structured and intuitive experience.
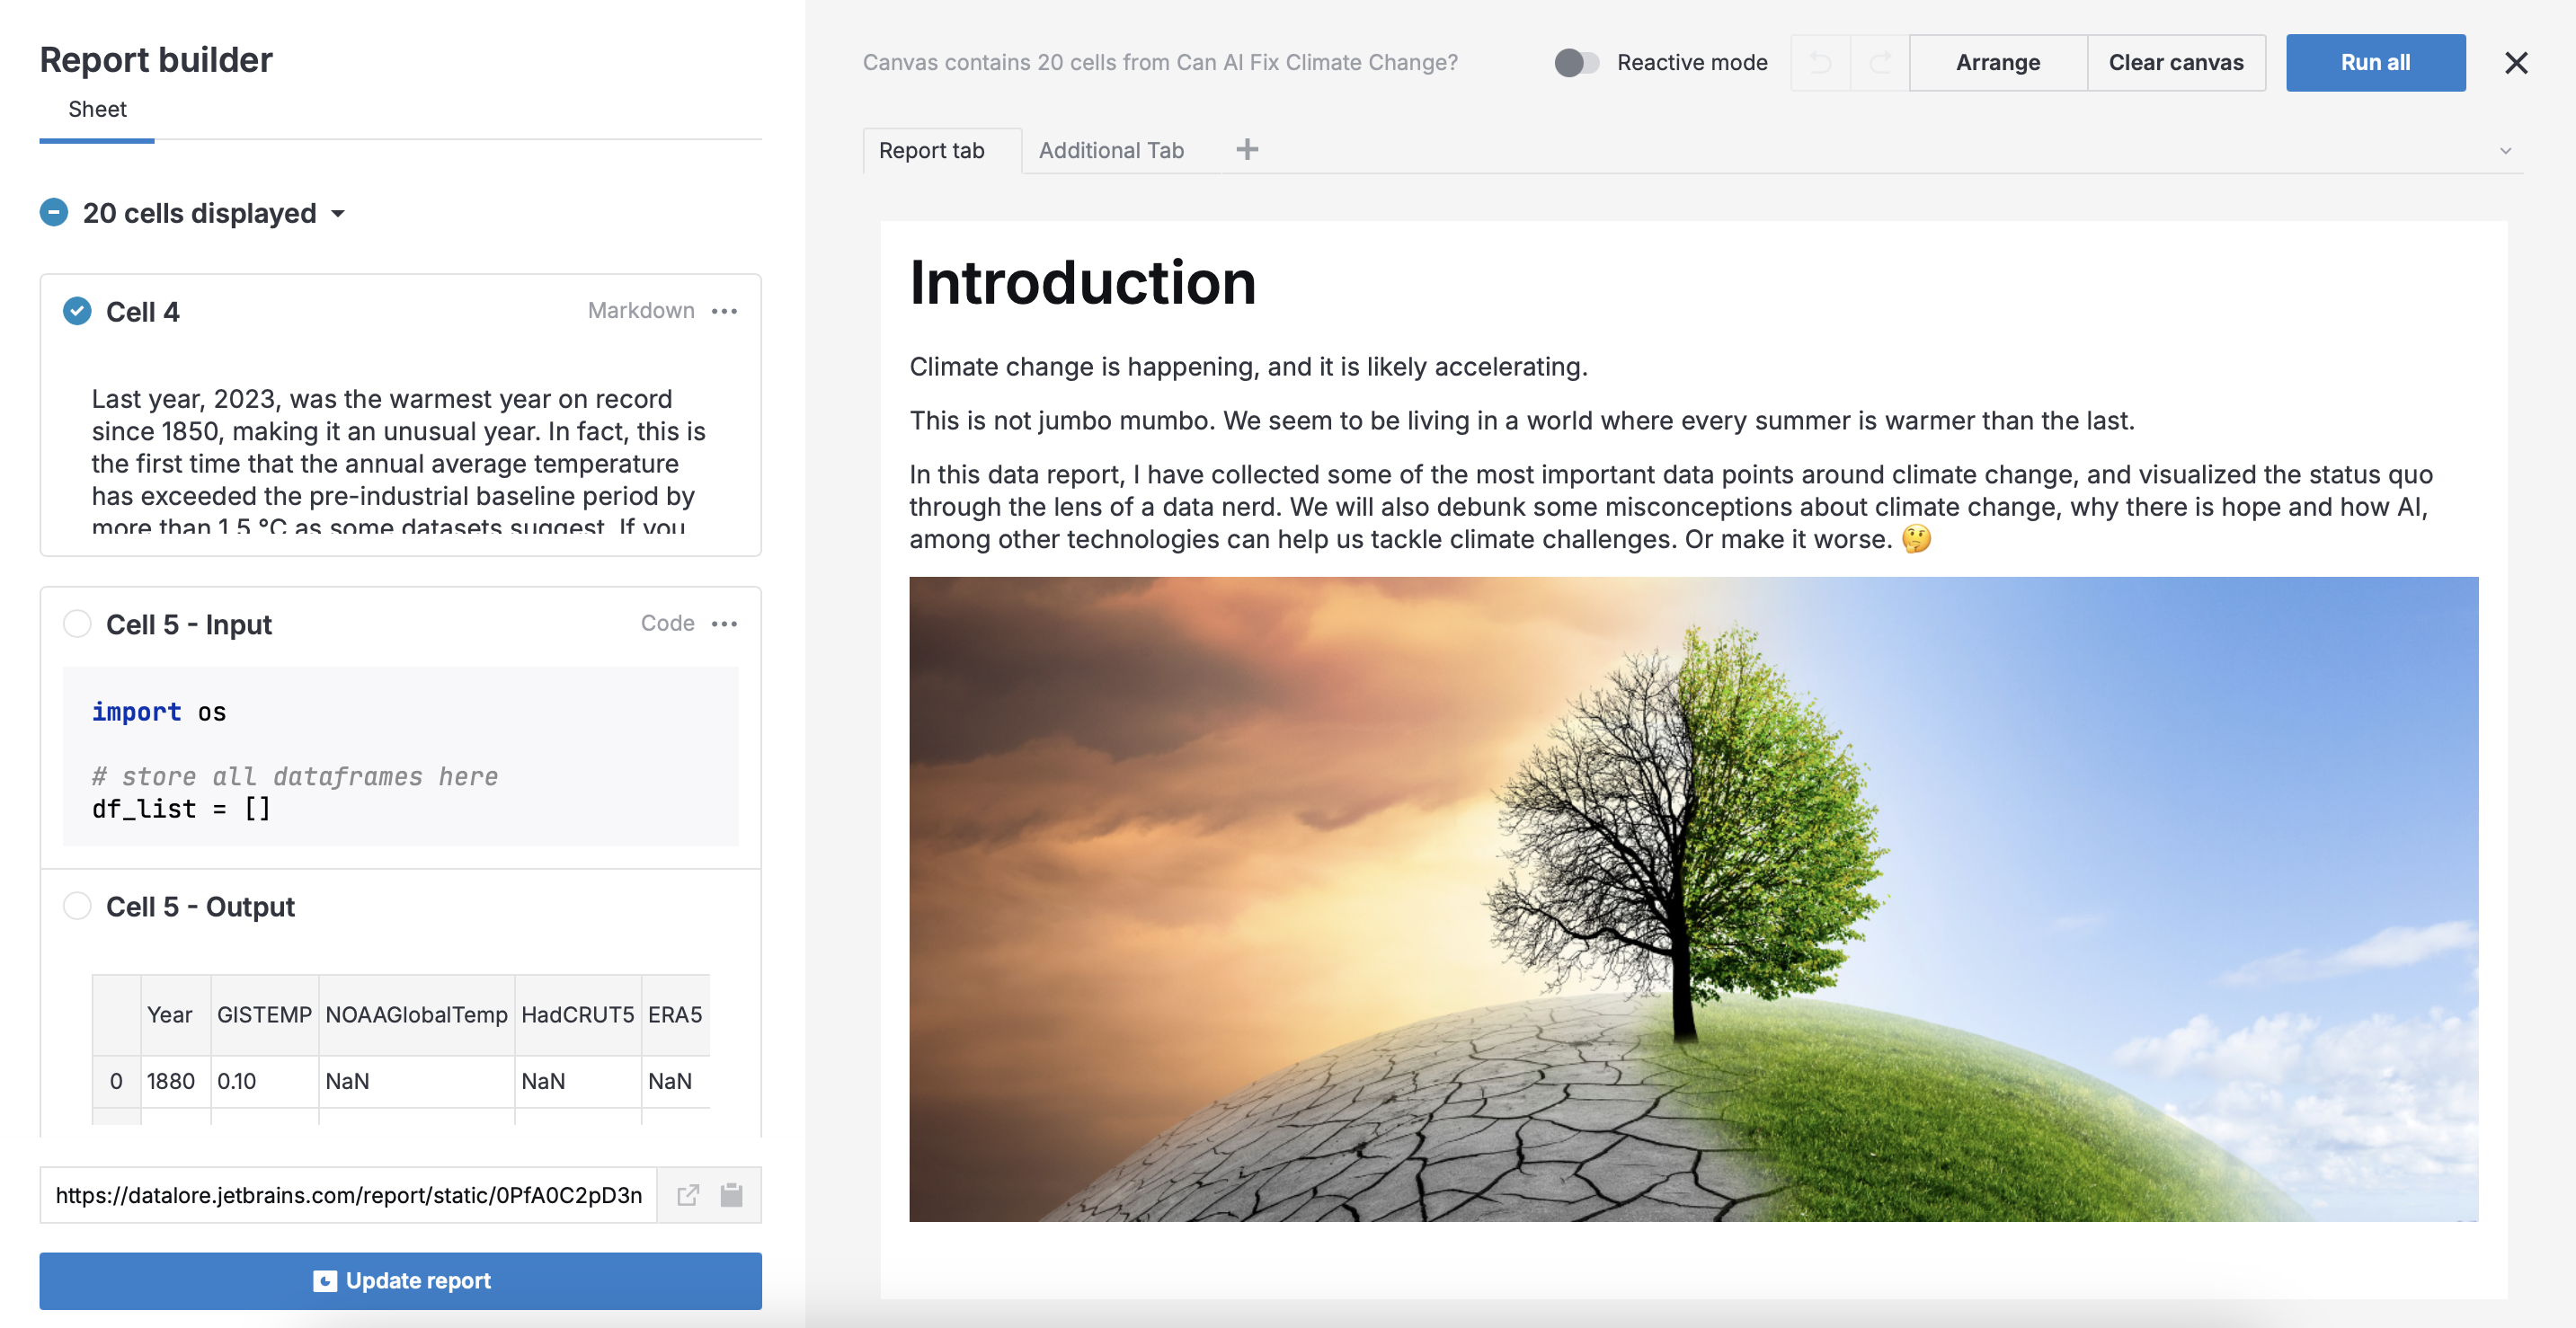
To hide the cell inputs or outputs that you don't want to present in the report, clear the checkboxes in the upper left corner of the respective items on the Cell list. Once deselected, the respective objects are removed from the Canvas. Alternatively, you can navigate to the cell on the Canvas and click Hide cell on the toolbar in its upper right corner.
note
If you select the checkboxes to place the removed objects back onto the Canvas, they will appear on the Canvas as close to their position in the notebook as possible.
To undo or redo an action, use the Undo and Redo icons in the upper part of the Report builder or respective shortcuts.
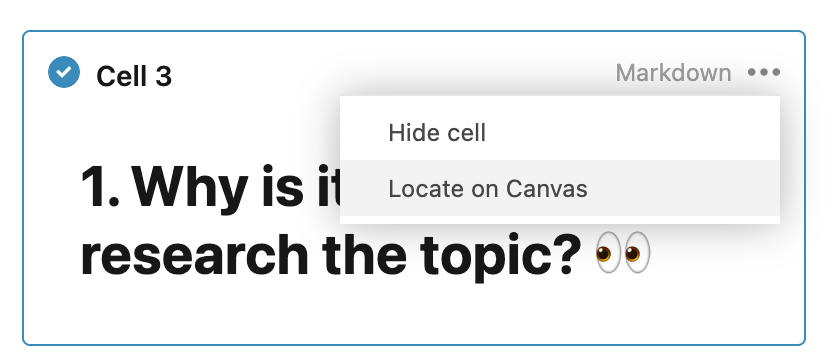
To navigate to a cell on the Canvas, click the ellipsis in the upper right corner of the respective item on the Cell list and select Locate on Canvas.
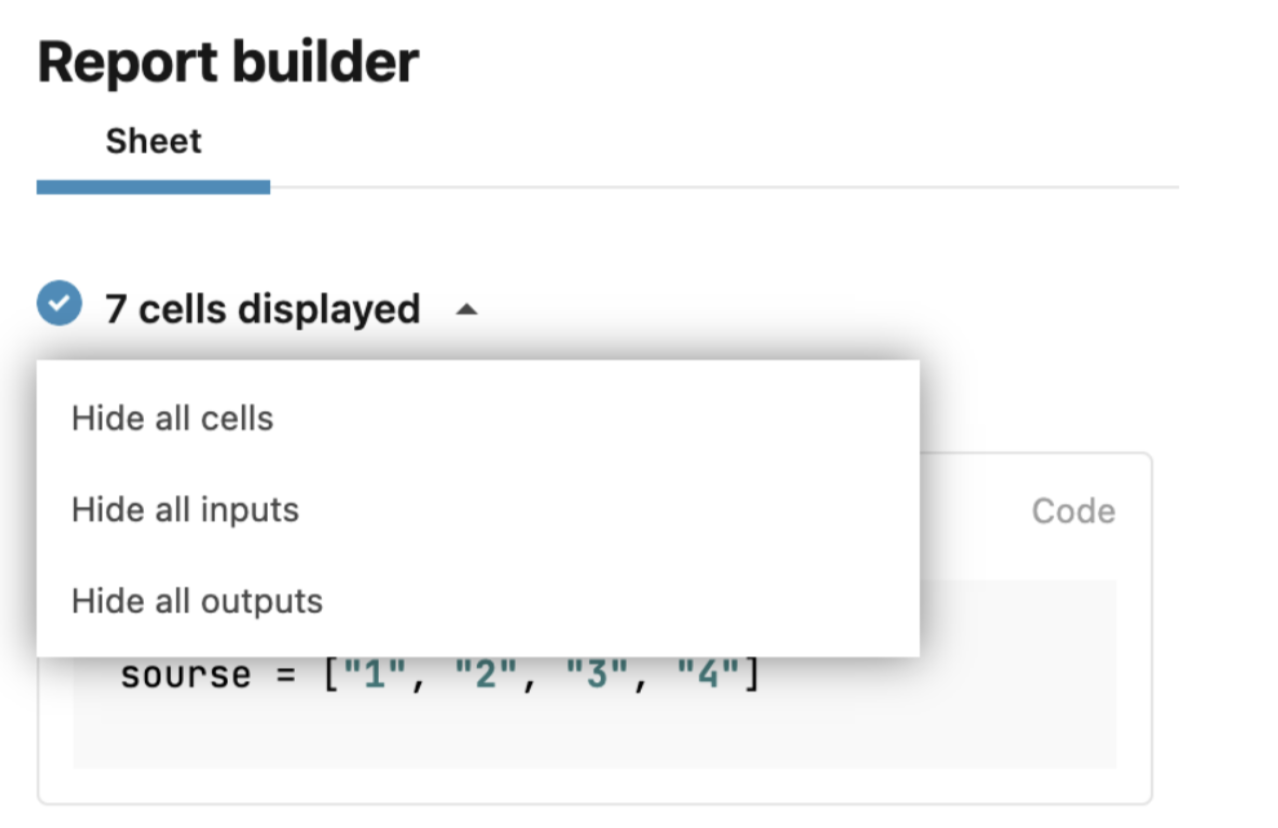
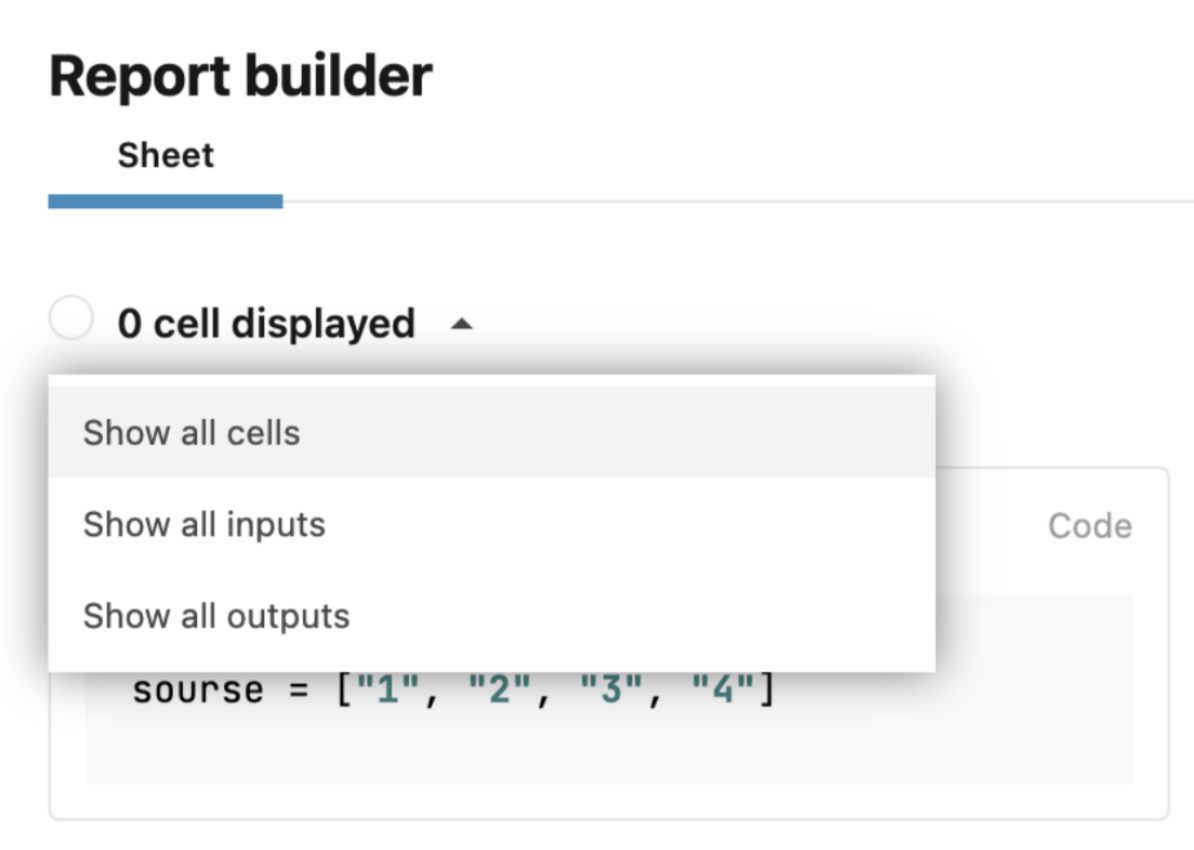
(Optional) Manage cell visibility in bulk: click [n] cells displayed on top of the Cell list and select one of these options: Hide all cells, Hide all inputs, or Hide all outputs.
tip
Keep in mind that after hiding all outputs or inputs, you cannot select to show them again from the same list of options. Your steps are:
First, select to hide all cells.
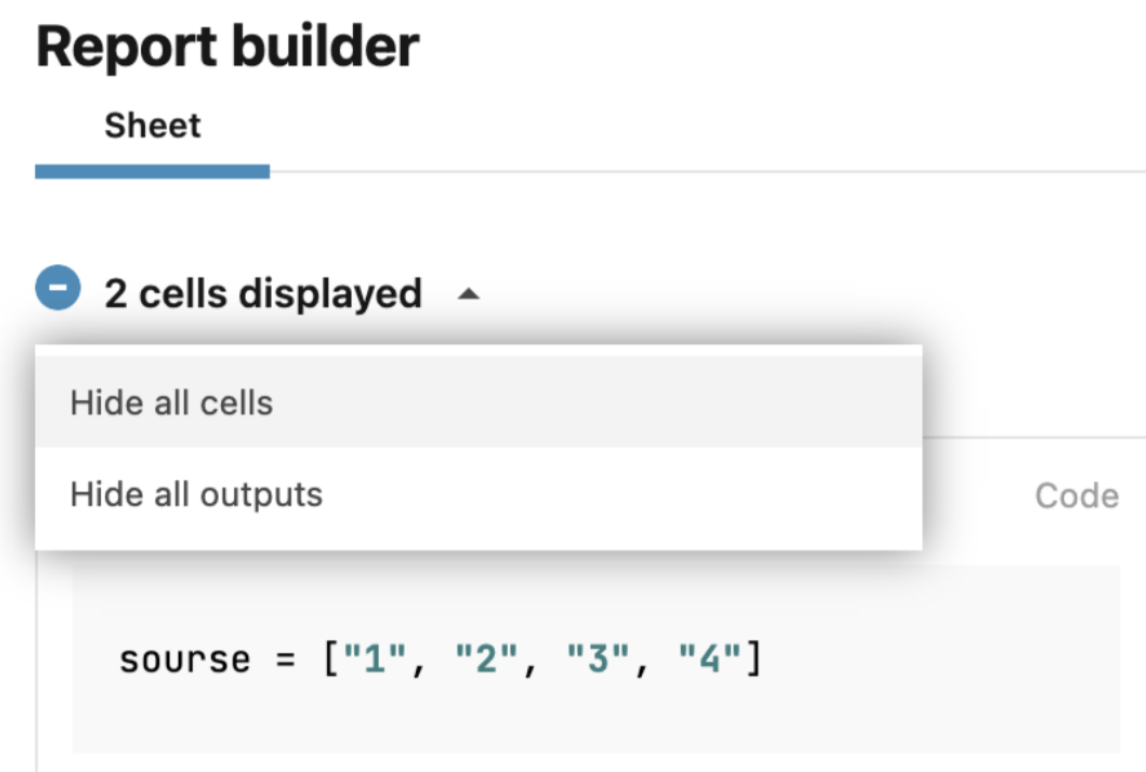
Select what you want to show.
Change the layout. You have the following options:
- Resize cells
To resize a cell manually, drag the resize handles placed on its borders.
To select a preset cell width, click Change width on the cell toolbar and choose an option (Full width, 1/2 width, or 1/3 width).
You can drag another cell into the same grid row if you free up enough space by resizing the first cell.
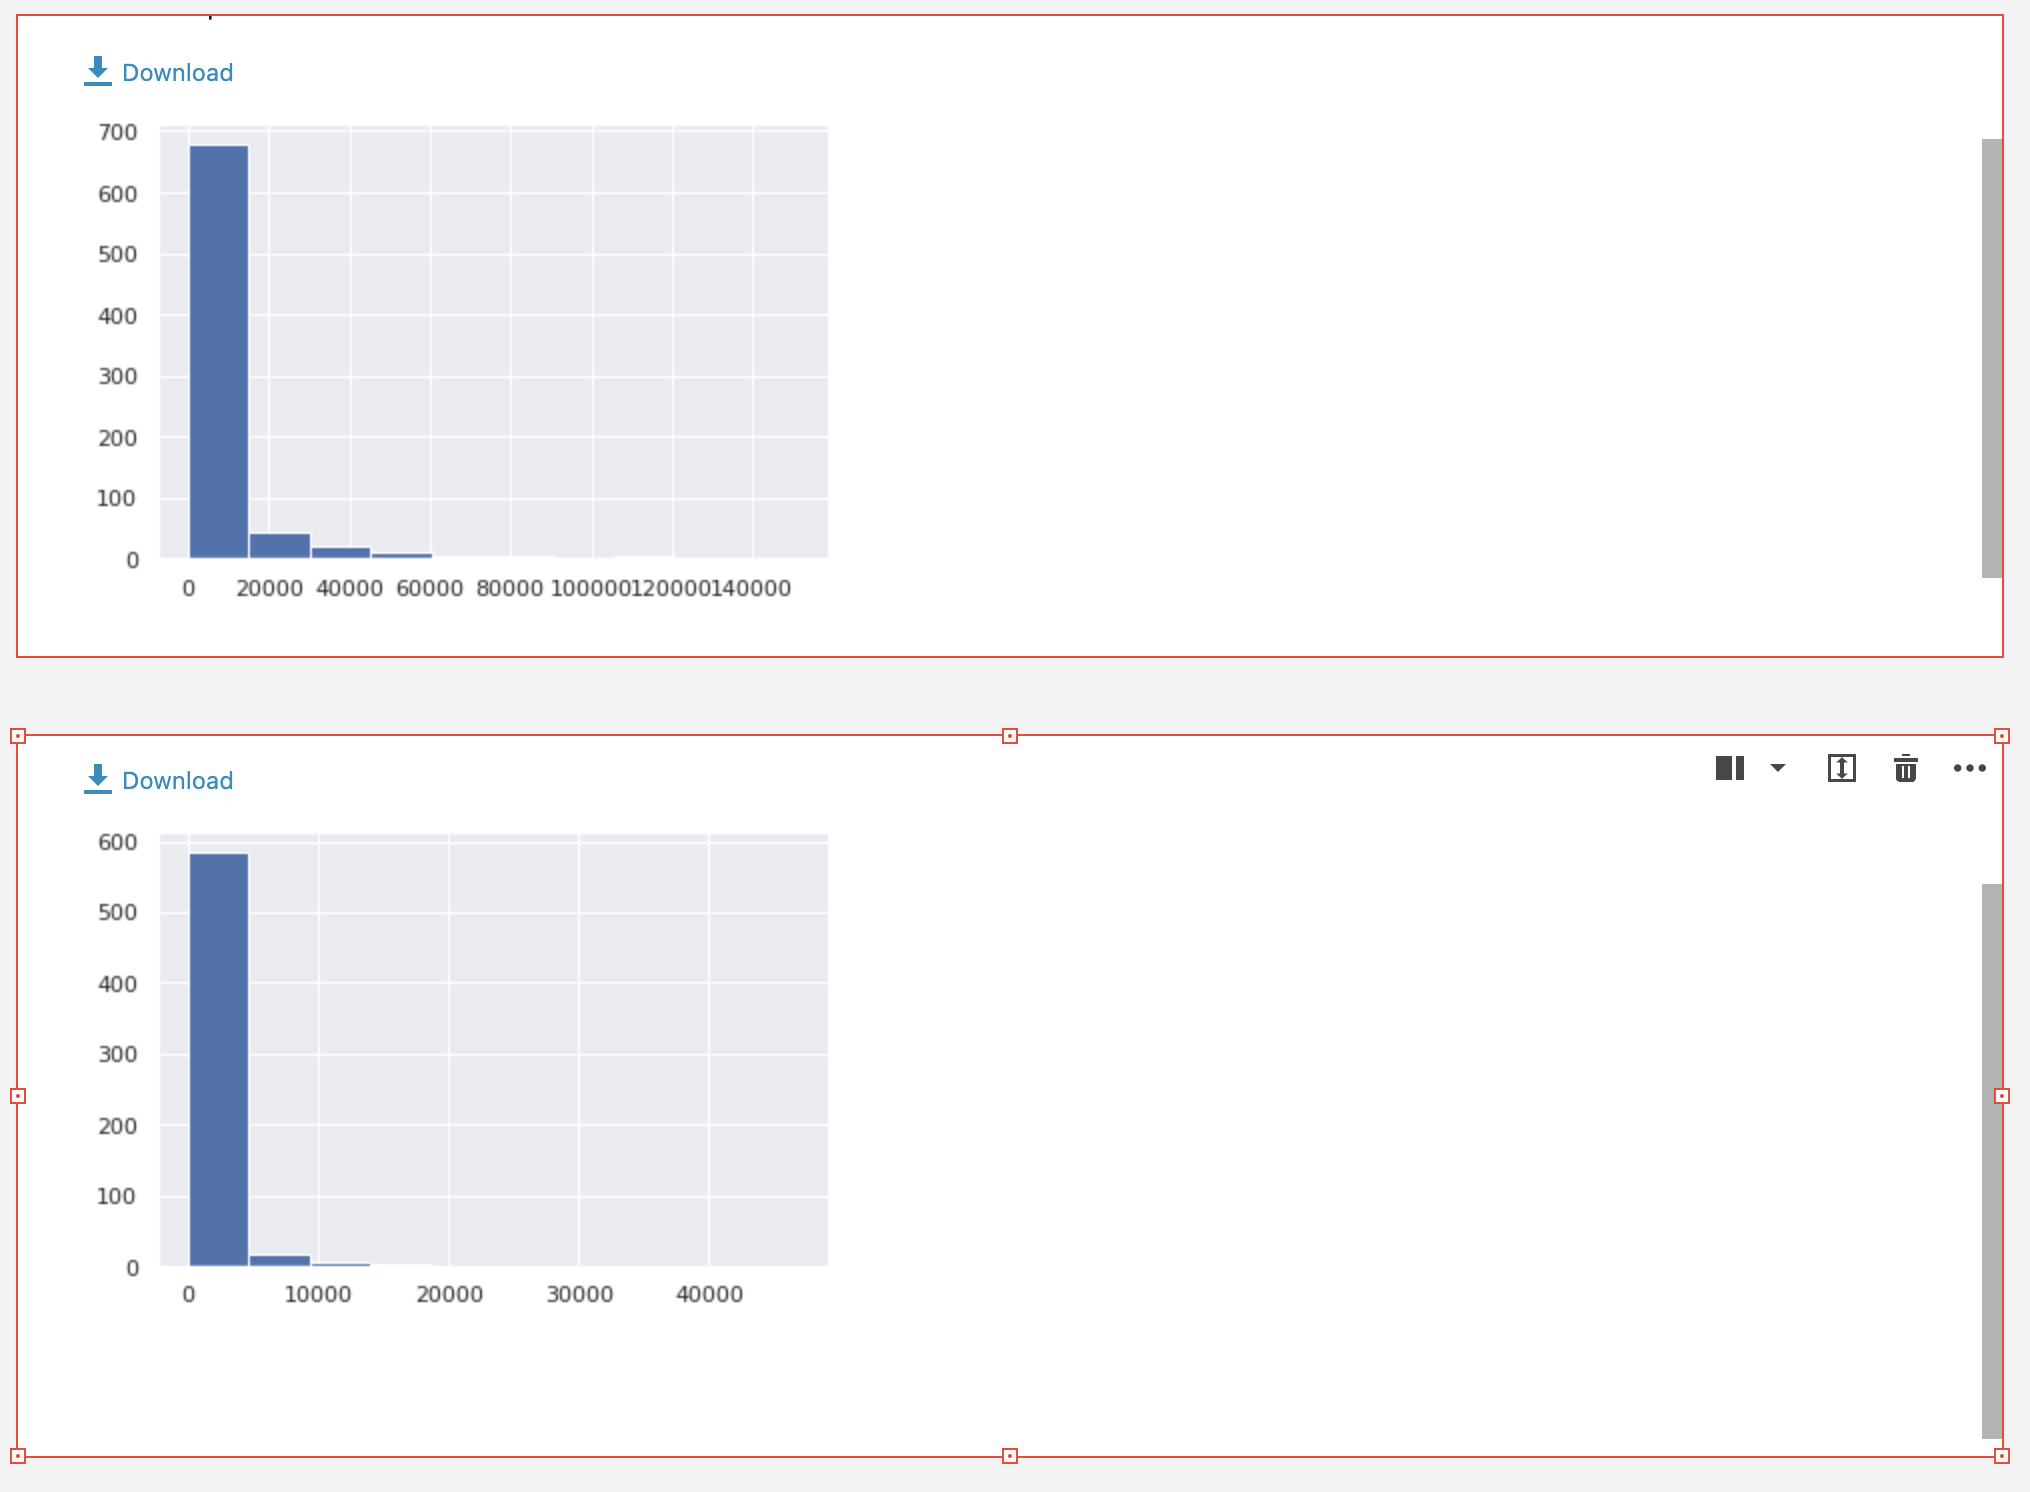
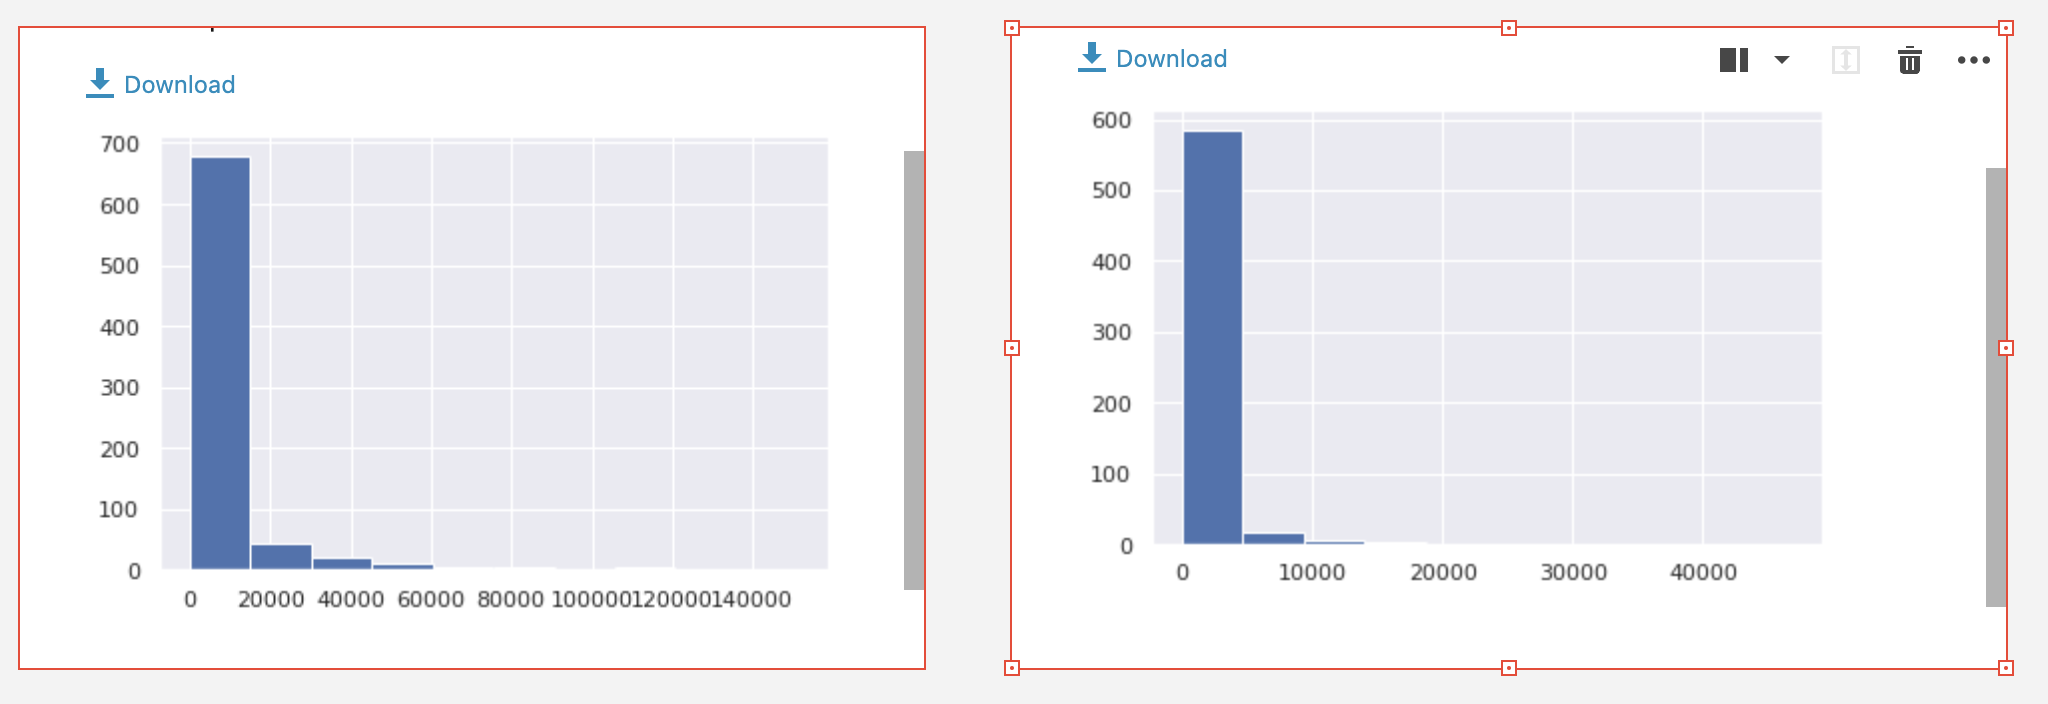
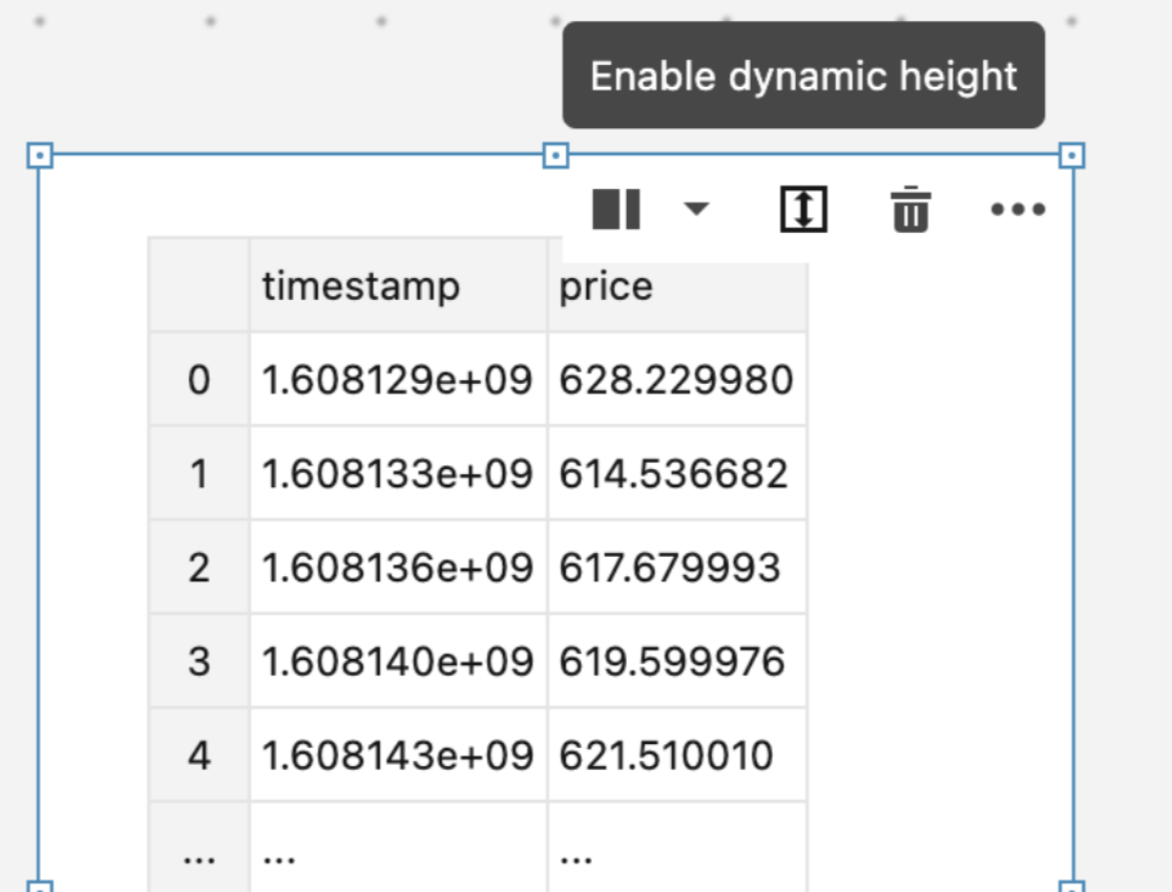
For a cell to adjust its height to the output, click the Enable dynamic height icon on the toolbar of the respective cell.
note
Keep in mind that as a result you may have a report with very big table outputs.
- Drag and drop cells
You snap the cell to the grid area that has the drop shadow effect as you drag the cell across the Canvas.
If you drop the cell onto the cell that appears in focus, the cells swap their positions on the grid.
You can add cells to the Canvas by dragging them from the Cell list. This is one more way of adding objects to the grid. Besides, you do not have to drag a cell across the grid while looking for the place to drop it. You can scroll the grid to the place where you want to add the cell and then drag it from the Cell list. If you drop such a cell onto another one on the grid, the newly added cell removes the other one from the Canvas.
You can select multiple cells on your canvas (⌘ / Ctrl) to drag them as one item across the working area.
You can easily organize the content of your notebook into multiple views with tabs.
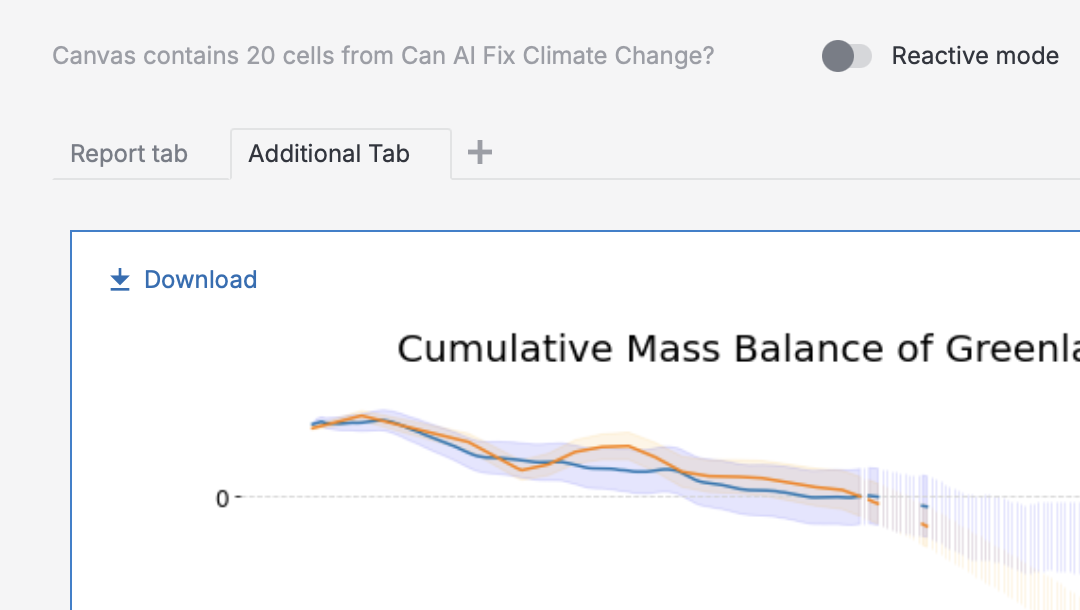
You can enable Reactive mode (toggle on top of the Canvas) if you want to publish an interactive report. With this mode on, you will have your report automatically recalculated when viewers interact with it.
note
By default, the report inherits the Reactive mode setting from the notebook.
Click the Run all button on top of the Canvas to recalculate the entire notebook and view what the report looks like.
To edit a cell in the notebook, click the ellipsis on the toolbar of the respective cell and select Edit in notebook. This will collapse the Report builder and open the editor with focus on the respective cell.
note
If the notebook has errors, you will see a notification on top of the Canvas. Cells containing errors in code are marked with red borders both on the Cell list and Canvas.
tip
You can perform the above steps in any order you prefer.
After you prepare the notebook as a report, go on with the following procedures.
Publish a report: describes the process of publishing the notebook as a report.
Invite report viewers: describes the process of inviting users to view a report with restricted access.
Manage reports in workspaces: describes managing published reports in workspaces.