Analyze test results
Before running coverage analysis , make sure that the PDB information exists for all target assemblies. The safest choice would be to build your code with the Debug build configuration.
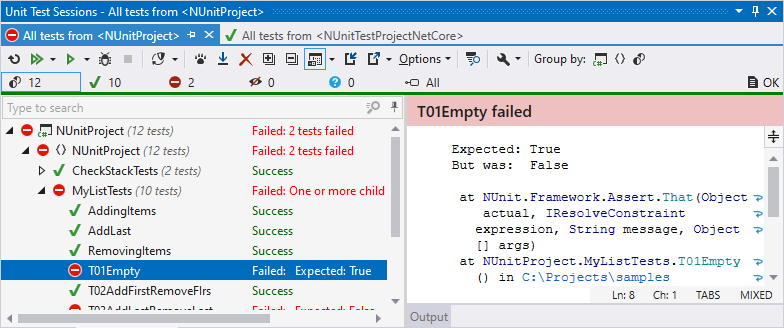
When test execution is over, the results are visualized in the Unit Test Sessions window.

The output pane (which you can place on the right or at the bottom using the Show Output ![]() button on the toolbar) displays output of the selected test. If the test is failed, dotCover also adds short information on the failure and/or displays the stack trace of an exception. You can use clickable links in the output pane to navigate directly to types and methods involved with the failure. If the output displays a link to a file that does not belong to the solution, you can click this link to open the file in an external application associated with the corresponding file type or Ctrl-click to open it in Visual Studio.
button on the toolbar) displays output of the selected test. If the test is failed, dotCover also adds short information on the failure and/or displays the stack trace of an exception. You can use clickable links in the output pane to navigate directly to types and methods involved with the failure. If the output displays a link to a file that does not belong to the solution, you can click this link to open the file in an external application associated with the corresponding file type or Ctrl-click to open it in Visual Studio.
By default, dotCover wraps long lines in the output according to the current width of the output area. If necessary, you choose not to wrap long lines by clearing the Wrap long lines in Unit Test Session output checkbox on the Tools | Unit Testing page of dotCover options .
Use the Group by selector on the toolbar to change grouping of the tests — you can either choose one of the predefined grouping modes in the upper part of the selector, such as Test Hierarchy, Project Structure, and so on, or use the lower part of the selector to choose a custom set of grouping properties.
On the status bar, you can see the total number of tests in the session as well as number of tests in different states:
![]()
By default, tests in all states are shown, but you can click the corresponding icons to filter tests by their state. You can also Ctrl-click several icons to display tests in several different states.
Status of each test in the Unit Test Sessions window is displayed with one of the following icons:
| Unit test is currently executing |
| Unit test is scheduled for execution in the current run |
| Unit test was not executed |
| Unit test passed in the lats test run |
| Unit test failed in the lats test run |
| Unit test was ignored in the last test run Either it has the corresponding attribute (for example |
| Unit test was aborted in the last test run |
| Unit test was started but dotCover could not read the test runner output. This normally happens when you abort test execution, but could also be a sign of an error occurring in the test runner. |
The same icons are used to display status of grouping items (classes, projects, and so on)
The icons are also used on each session's tab to display the overall execution result of the sessions.
The corresponding icons above the test session tree show how many tests are in each of the states. The ![]() icon shows the total number of tests in the session.
icon shows the total number of tests in the session.
Using these icons, you can filter the tree so that only tests in the corresponding status are displayed.
There is one more way you can control unit test results.

The icon on the status bar of the main Visual Studio window will notify you if there are any failed tests or tests that were changed. Note that the icon notifies you about the results of all tests from all sessions. If the continuous testing mode is enabled for a session, the icon will also notify you about affected tests from this session.
| All tests have passed. There are no changed or affected tests. |
| Some tests have failed in the last test run, and there were no more changed or affected tests. |
| Some tests were changed or became outdated after the last test run. This status icon may appear together with the 'failed' icon if there were failed tests in the previous run. |
| Running tests is in progress. |
For status bar icons other than 'passed', dotCover displays the number of tests in this status. You can subsequently click this number to navigate to these tests in the editor.
You can also double-click the status icon to see details. dotCover will open the Unit Test Sessions window. If there are changed or failed tests, dotCover will automatically navigate you to the relevant ones.
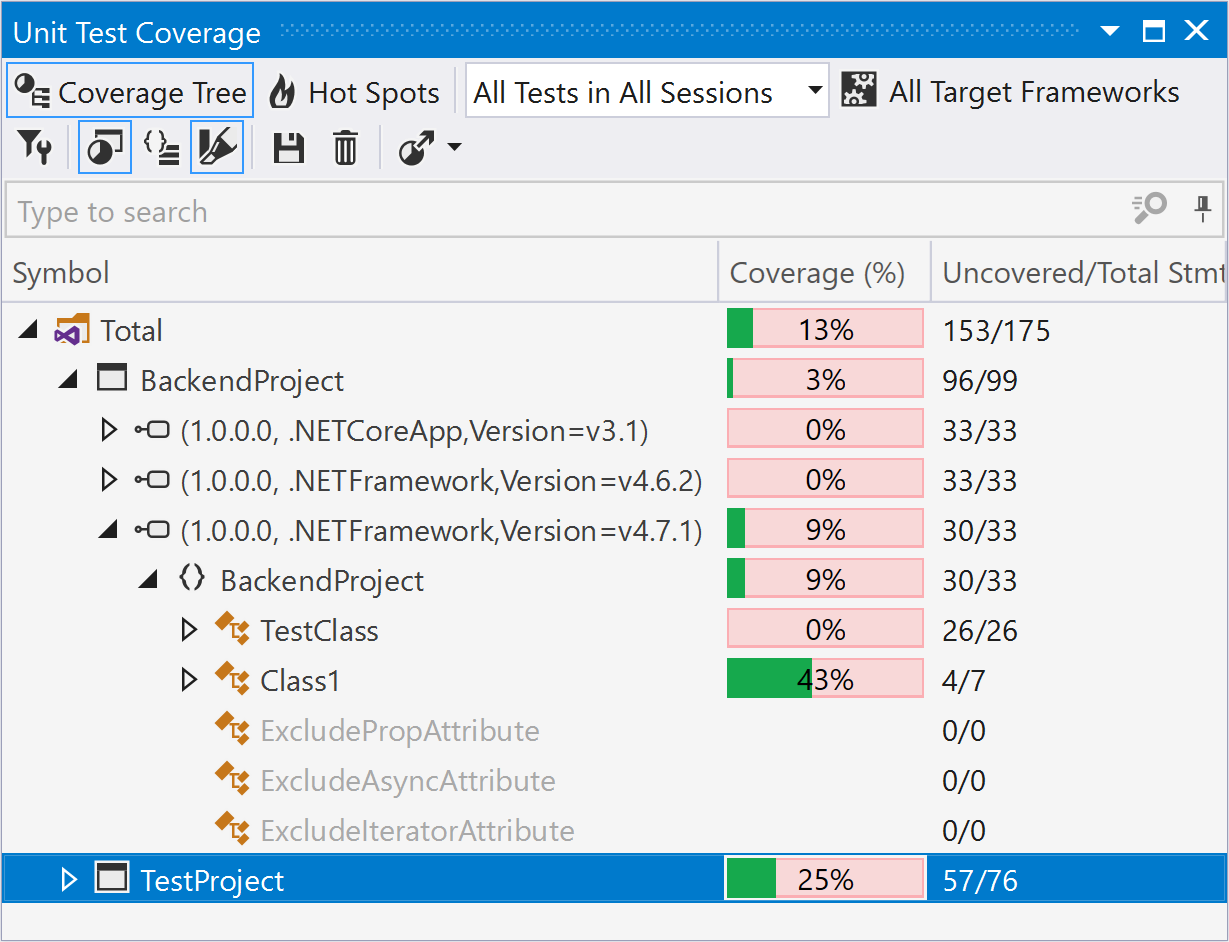
After running coverage analysis of unit tests, you can study coverage results in the opened Unit Test Coverage window. The window displays the code coverage tree of the whole solution. You can also switch to the hot spot view by clicking Hot Spots on the toolbar.

Different ways of exploring coverage results are described in the Work with Coverage Results section.
Unit Test Sessions window includes test execution log that lets you separate problems related to test execution process from unit tests results.
You will normally need to check execution log if some of your tests have the 'Inconclusive' state after execution, which could be a sign of an error occurring in the test runner.
If you have errors reported either by the test runner or dotCover, the number of errors is displayed on the right side of the window's status bar, else OK is shown.
To display or hide the execution log, click the Log ![]() button.
button.
By default, only events with the 'Error' severity level are logged. If necessary, you can change the minimum severity level. To do so, either right-click the log area and choose the desired severity level or use the Maximum severity of log entries selector on the Tools | Unit Testing | General page of dotCover options Alt+R, O.
You can also copy the whole log to the clipboard by choosing the corresponding command in the context menu.