Run and debug C# unit tests
note
The functionality described below is only available in .NET/.NET Core and ASP.NET Core projects and requires Smart Mode to be enabled.
JetBrains Fleet helps you run and debug unit tests from the most common .NET testing frameworks: NUnit, MSTests v2, and xUnit.
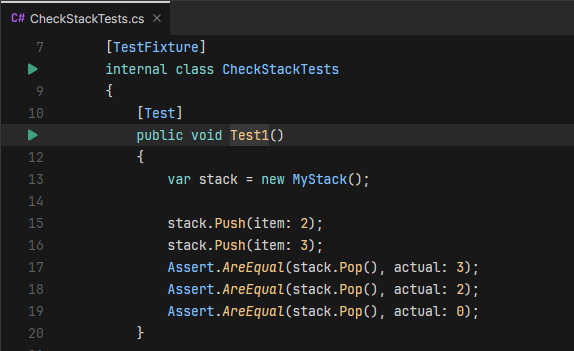
JetBrains Fleet discovers unit test classes and single unit tests of all supported frameworks right in the editor and adds the corresponding action indicators next to each item in the editor:

When you click those indicators, you can choose to run or debug the corresponding test or all tests in a test class.
You can also run unit tests for the desired part of the solution from the Solution tool — right-click the solution node, or alternatively, one or more selected project nodes or C# files that contain unit tests, and choose Run Unit Tests from the context menu.
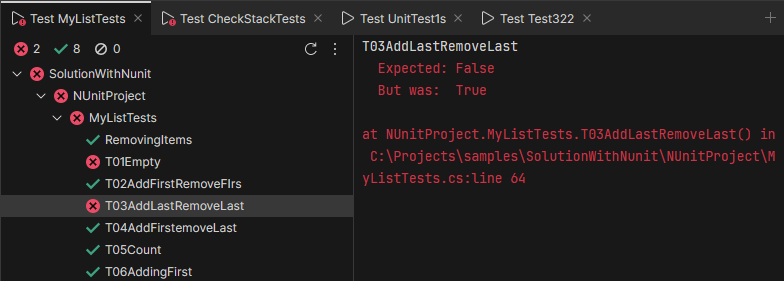
Independently of how you've started the tests, you will see the results of each run in a tool window. In this view, you can study the results of the selected failed test, double-click tests to locate their source in the editor, or click ![]() to start all executed tests again.
to start all executed tests again.

After the execution, tests can have one of three states: Passed, Failed, and Ignored. The toolbar icons show the number of tests in each state, and you can also click them to only show tests in the desired state.
tip
To run or debug recently executed collections of unit tests, press or click Run on the toolbar, and then click Run or Debug next to the desired collection.