Async ProfilerUltimate
OS: Linux and macOS
Configure: Settings/Preferences | Build, Execution, Deployment | Java Profiler
Async Profiler monitors JVM-level parameters of your application to provide a better understanding of how your application is executed and how exactly memory and CPU resources are allocated. This data can help you find and resolve performance problems and bottlenecks.
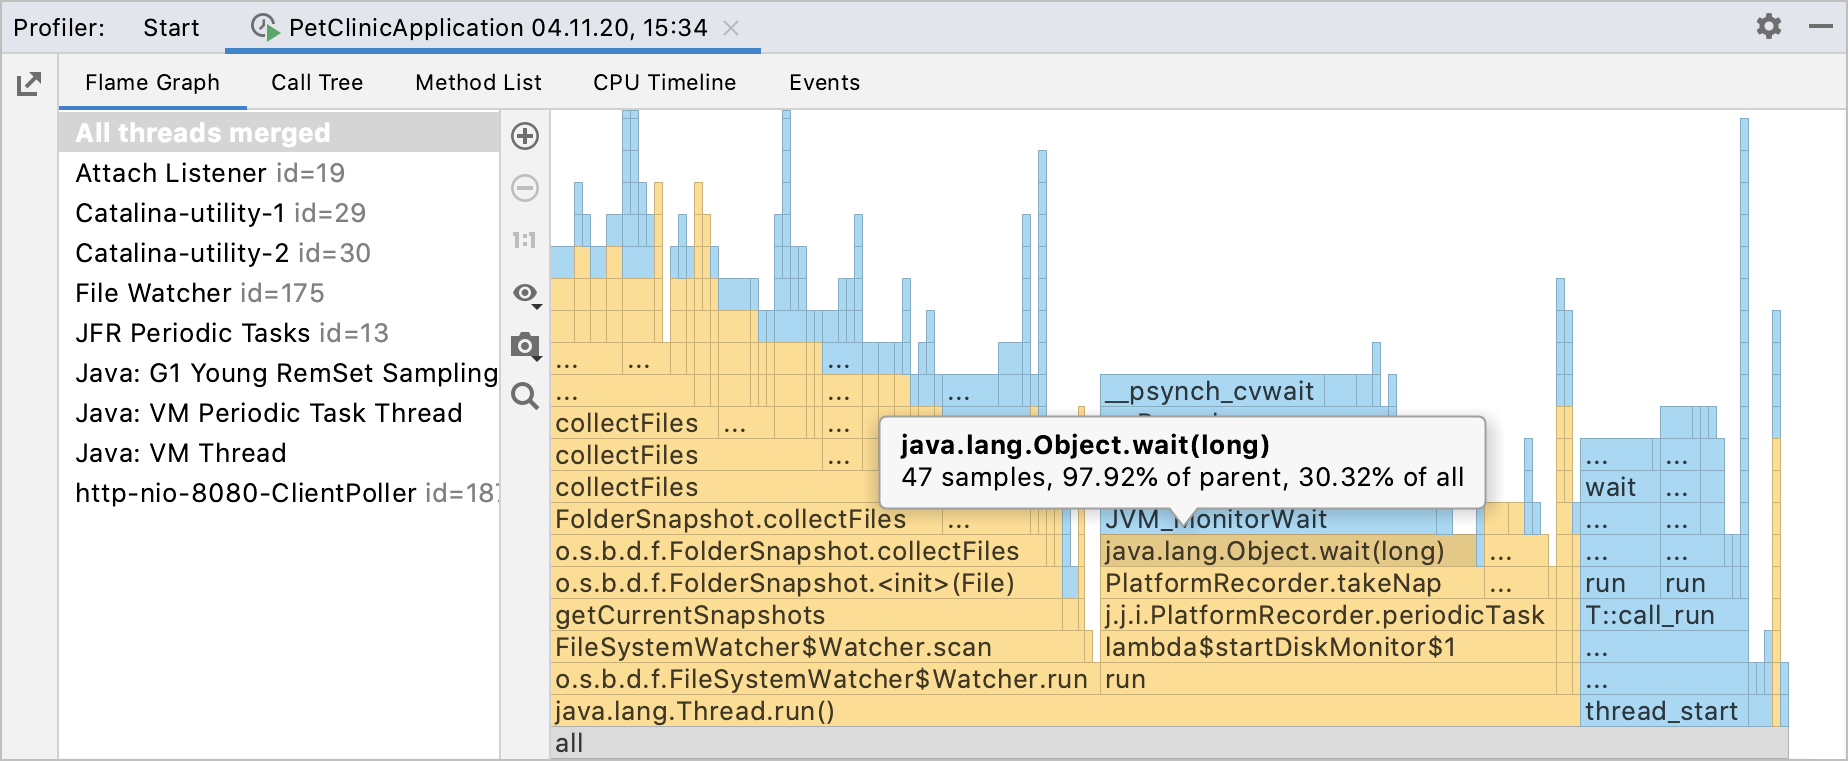
Async Profiler does not require threads to be at safe points to be able to sample stacks, which means that it avoids the safepoint bias problem. On top of that, the profiler features Flame Graph support that allows it to visualize stack traces.
note
Async profiler supports HotSpot JVM and some other Java runtimes.

Adjust kernel options before you start using the profiler on Linux. On macOS, the profiler works out of the box.
Adjust kernel options on Linux
Adjust perf_event_paranoid. This option controls the use of the performance events data by non-root users.
Set the value to be less than 2 to let the profiler collect performance information without root privileges:
sudo sh -c 'echo 1 >/proc/sys/kernel/perf_event_paranoid'Adjust kptr_restrict. This option sets restrictions on exposing kernel addresses.
To have kernel symbols properly resolved, disable the protection offered by kptr_restrict by setting its value to 0:
sudo sh -c 'echo 0 >/proc/sys/kernel/kptr_restrict'
By default, these changes affect your current OS session only. To keep the settings across system reboots, run:
sudo sh -c 'echo kernel.perf_event_paranoid=1 >> /etc/sysctl.d/99-perf.conf'
sudo sh -c 'echo kernel.kptr_restrict=0 >> /etc/sysctl.d/99-perf.conf'
sudo sh -c 'sysctl --system'
Profiler configurations
IntelliJ IDEA features two pre-defined Async Profiler configurations: the CPU profiler and the memory allocation profiler that you can find in Settings/Preferences | Build, Execution, Deployment | Java Profiler.

These configurations are adjusted to provide the most accurate results, that is why they don't require any modifications. However, you can still change the values in the settings.