Run/Debug Configuration: Attach to Node.js/Chrome
Create:
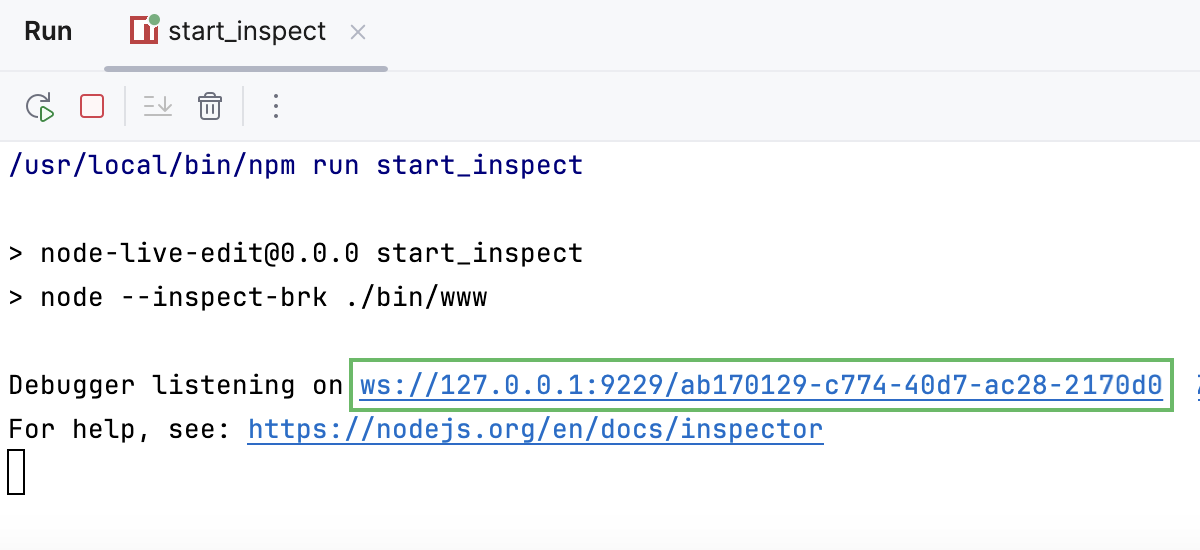
In this dialog, create configurations for debugging already running Node.js applications. This approach gives you the possibility to re-start a debugging session without re-starting the Node.js server.
Also use this configuration to debug background and additional main processes of NW.js applications, refer to Run/Debug Configuration: NW.js.
With this configuration, you can also debug Chrome extensions.
Before you start
Download and install Node.js.
Install the Node.js plugin on the Settings | Plugins page, tab Marketplace, as described in Installing plugins from JetBrains Marketplace.
Specific Attach to Node.js/Chrome configuration settings
Item | Description |
|---|---|
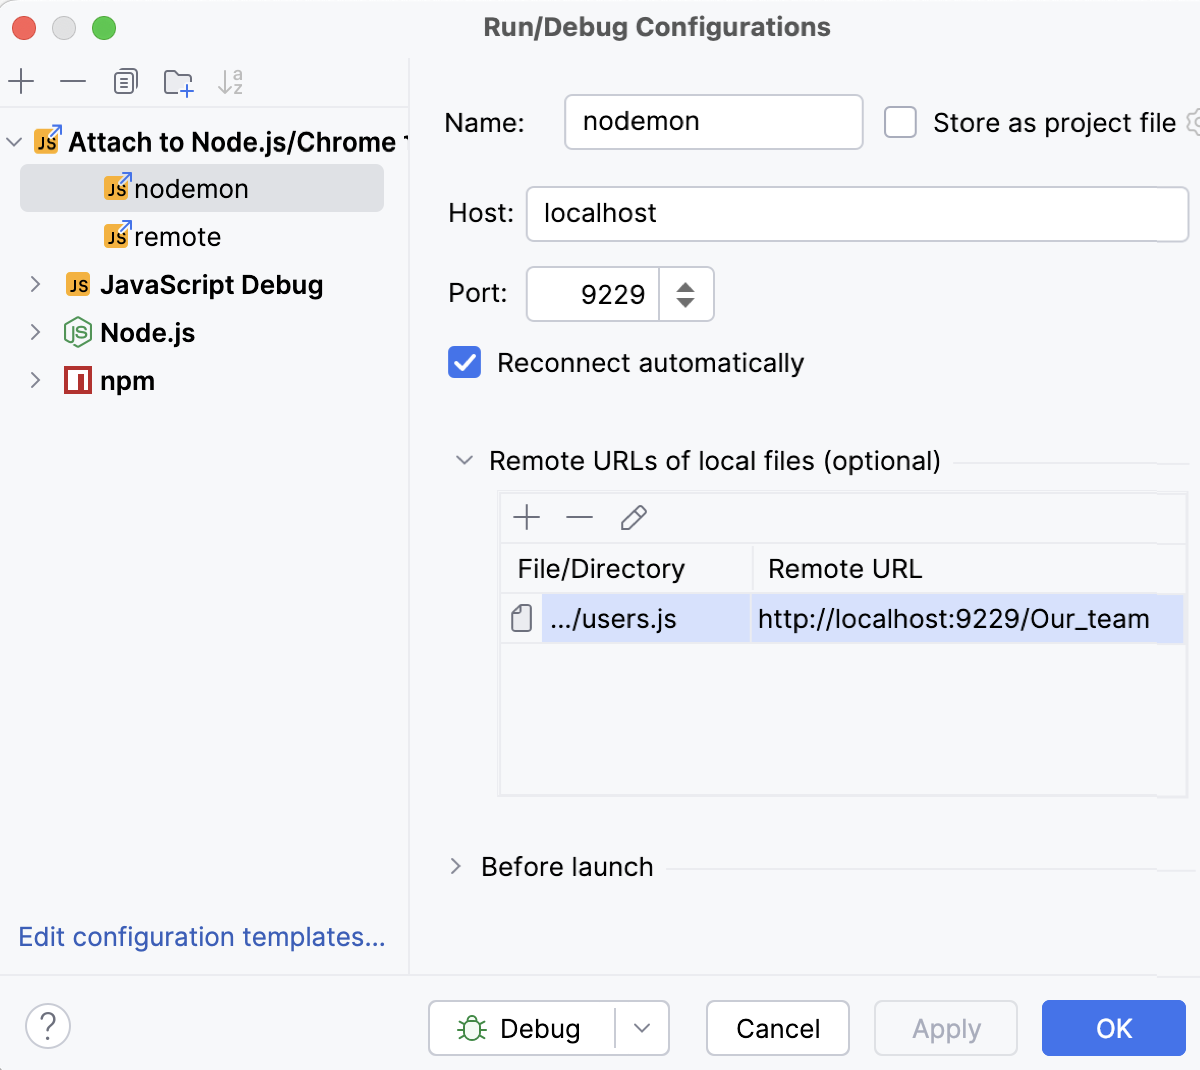
Host | In this field, specify the host where the application is running. |
Port | In this field, specify the port passed to  |
Reconnect automatically | Select this checkbox to enable the IntelliJ IDEA built-in debugger to re-attach to a running Node.js process after the code of the application is changed. This lets you debug Node.js applications that use the nodemon utility, which automatically reloads your Node.js process when the code is updated. For more information, refer to Debugging an application that uses nodemon. |
Remote URLs of local files | In this area, specify the remote paths for the project folders. This is helpful if the root folder of the running application is different from the name of your IntelliJ IDEA project root folder. In the example below, the IntelliJ IDEA project root folder /Users/WsProjects/express is mapped to /usr/src/app on the server.  |
Common settings
When you edit a run configuration (but not a run configuration template), you can specify the following options:
Item | Description |
|---|---|
Name | Specify a name for the run configuration to quickly identify it among others when editing or running. |
Allow multiple instances | Allow running multiple instances of this run configuration in parallel. By default, it is disabled, and when you start this configuration while another instance is still running, IntelliJ IDEA suggests stopping the running instance and starting another one. This is helpful when a run configuration consumes a lot of resources and there is no good reason to run multiple instances. |
Store as project file | Save the file with the run configuration settings to share it with other team members. The default location is .idea/runConfigurations. However, if you do not want to share the .idea directory, you can save the configuration to any other directory within the project. By default, it is disabled, and IntelliJ IDEA stores run configuration settings in .idea/workspace.xml. |
Toolbar
The tree view of run/debug configurations has a toolbar that helps you manage configurations available in your project as well as adjust default configurations templates.
Item | Shortcut | Description |
|---|---|---|
Alt+Insert | Create a run/debug configuration. | |
Alt+Delete | Delete the selected run/debug configuration. Note that you cannot delete default configurations. | |
Ctrl+D | Create a copy of the selected run/debug configuration. Note that you create copies of default configurations. | |
The button is displayed only when you select a temporary configuration. Click this button to save a temporary configuration as permanent. | ||
Move into new folder / Create new folder. You can group run/debug configurations by placing them into folders. To create a folder, select the configurations within a category, click Then, to move a configuration into a folder, between the folders or out of a folder, use drag or To remove grouping, select a folder and click | ||
Click this button to sort configurations in the alphabetical order. |
Before launch
In this area, you can specify tasks to be performed before starting the selected run/debug configuration. The tasks are performed in the order they appear in the list.
Item | Shortcut | Description |
|---|---|---|
Alt+Insert | Click this icon to add one of the following available tasks:
| |
Alt+Delete | Click this icon to remove the selected task from the list. | |
Enter | Click this icon to edit the selected task. Make the necessary changes in the dialog that opens. | |
Alt+Up Alt+Down | Click these icons to move the selected task one line up or down in the list. The tasks are performed in the order that they appear in the list. | |
Show this page | Select this checkbox to show the run/debug configuration settings prior to actually starting the run/debug configuration. | |
Activate tool window | By default this checkbox is selected and the Run or the Debug tool window opens when you start the run/debug configuration. Otherwise, if the checkbox is cleared, the tool window is hidden. However, when the configuration is running, you can open the corresponding tool window for it yourself by pressing Alt+4 or Alt+5. |
