Thread dumps
Thread dumps are a tool for examining the state of an application at a particular instant. They provide a list of the threads in the application together with their stack traces, which can be useful in debugging problems, such as deadlocks or unresponsive UI. The main advantage of thread dumps is their plain-text format and multitude of tools that can capture and process them.
IntelliJ IDEA lets you capture thread dumps for running processes as well as interpret external thread dumps taken in IntelliJ IDEA or another tool, such as jstack and jcmd.
IntelliJ IDEA supports formats produced by JDK tooling up to version 25.
Capture a thread dump from IntelliJ IDEA
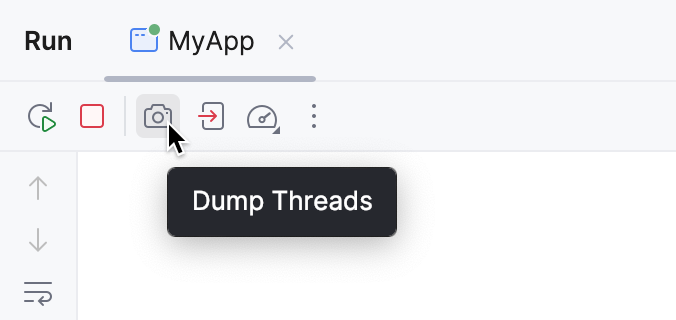
While running a program from IntelliJ IDEA: on the Run tool window's toolbar, click
Dump Threads.
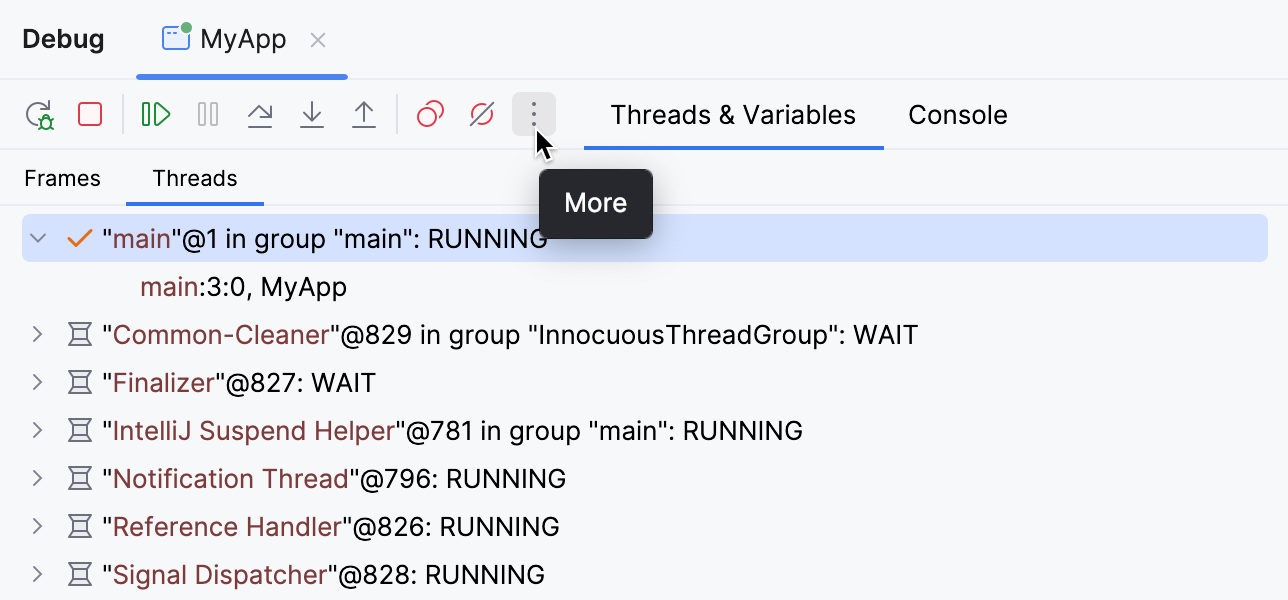
While debugging a program from IntelliJ IDEA: on the Debug tool window's toolbar, click
More, then select
Get Thread Dump.
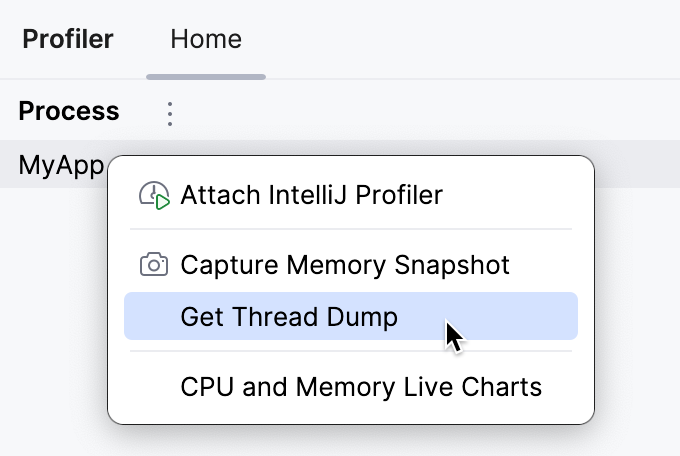
For any Java/Kotlin process running locally: On the Home tab of the Profiler tool window, click the process for which you want to create a thread dump. Select Get Thread Dump.
Open an external thread dump
In the Analyze Stack Trace dialog that opens, paste the thread dump into the Put a stack trace or a complete thread dump here: text area.
The thread dump opens in a new tool window tab. This view is customizable: you can apply filters and sorting, merge similar threads, and partially collapse the stack traces.
The icons near thread names indicate the thread's state:
Icon | Description |
|---|---|
Running/active – the default state, in which a thread is actively executing code | |
(for Kotlin coroutines) Running – a coroutine is actively executing code | |
Sleeping – occurs when a thread is in | |
Carrier thread – a platform thread that is currently executing a virtual thread, or a coroutine in the created/unknown state | |
| Waiting – occurs when a thread is waiting on an object monitor, or a coroutine is suspended |
Socket – occurs when a thread is performing network I/O | |
I/O – occurs when a thread is performing a non-network I/O operation | |
| EDT (Event Dispatch Thread) – the UI thread in Swing applications. |
Additionally, a wavy overlay indicates virtual threads and Kotlin coroutines, while daemon threads are indicated by a “ghost” overlay:

Some calls in the Run tool window have a dotted underline. These calls occur inside a try block and can throw a checked exception.
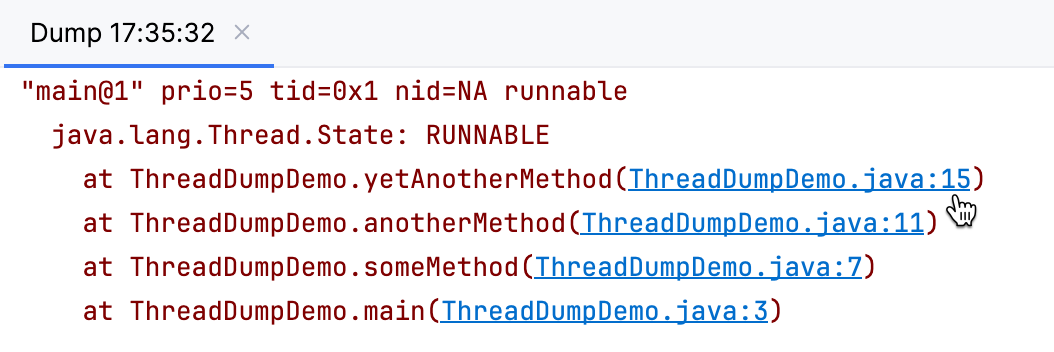
If you want to inspect a class that appears in the stack trace, you can navigate to it right from the thread dump.
Jump to source
Click the hyperlink in the stack trace.
If you want to save the thread dump for later inspection or send it to someone else, you can export it as a text file.
Export thread dump as a text file
On the toolbar, click Export to Text File.
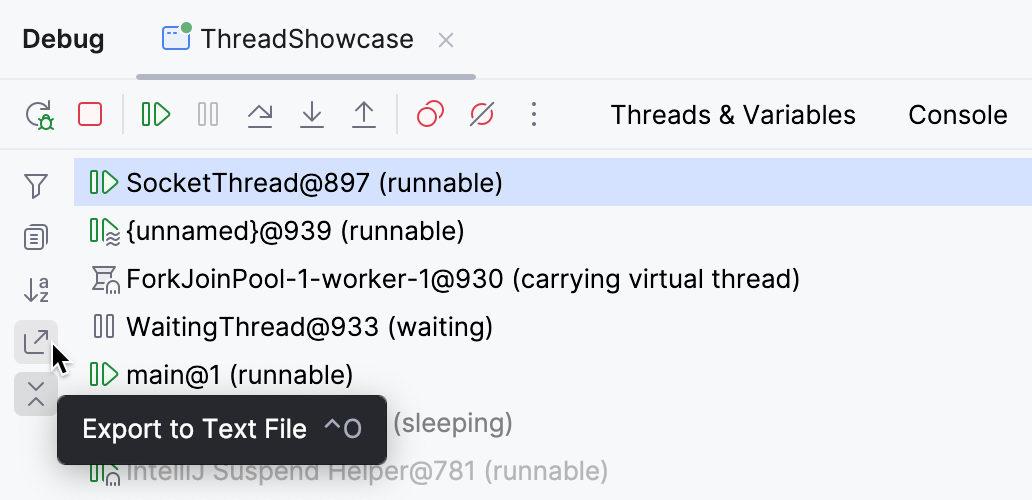
Specify the path and click Save.
IntelliJ IDEA's thread dump format
When viewing IntelliJ IDEA's thread dump in text format, you might notice additional information in the thread descriptions and stack traces.
Here is an example of how it looks like:
Each thread in the dump is represented with the following information:
Thread header Line
Thread header line goes first in every thread description and consists of:
Thread name in quotes
Optional flags indicating if a thread is daemon or virtual
Thread priority (
prio) – value managed by the JVM that indicates the thread's scheduling priority ranging from 1 (lowest) to 10 (highest). The default value is 5. These priorities may be mapped to OS-level thread priorities, however, the mapping is implementation-dependent, and priorities serve as hints to the scheduler rather than guarantees of execution order.Thread ID in hexadecimal (
tid)Native ID (
nid) – usuallyNAin IDE-generated dumps. This information is typically only available when thread dumps are generated by the JVM itselfThread state. The following states are recognized:
Thread state
Description
runnablethread is actively running or ready to run
sleepingthread is in a sleep state (
Thread.sleep())waiting on conditionthread is waiting for a condition
waiting for monitor entrythread is waiting to acquire a monitor lock
sleepingthread is in a sleep state (
Thread.sleep())parkingthread is parked (
LockSupport.park())on object monitorthread is waiting on an object monitor
idleevent dispatch thread is in an idle state
Thread state line
Thread state line goes right after the thread header line and contains the thread's state as indicated by the JVM. The following states are possible:
Thread state | Description |
|---|---|
| a thread that has not yet started execution |
| a thread executing in the Java virtual machine |
| a thread blocked waiting for a monitor lock |
| a thread waiting indefinitely for another thread to perform a particular action |
| a thread waiting for another thread to perform an action for up to a specified waiting time |
| a thread that has finished execution |
For more information on thread states, refer to official Java documentation.
Stack trace
The stack trace shows the sequence of method calls for the thread, characterized by the following:
Each line in the stack trace begins with a tab character.
Method calls are listed from top (recent/called methods) to bottom (earlier/calling methods).
Each line follows the format:
at package.class.method(SourceFile:LineNumber). When IntelliJ IDEA recognizes the source file, you can use it to navigate to the source code.
Lock information
When available, IntelliJ IDEA's thread dumps provide information about locks held by the thread, including:
Monitors owned by this thread
Threads blocked by this thread
Monitors this thread is waiting for
Lock objects with their class and memory address
Kotlin coroutines
You can view Kotlin coroutines in IntelliJ IDEA's thread dumps alongside Java threads. For example:
The coroutines information is formatted as follows:
Name and ID: The coroutine name followed by its unique ID, for example,
coroutine:1State: The coroutine's current state, for example,
SUSPENDEDDispatcher: Information about the dispatcher the coroutine is using, for example
Dispatchers.IOStack trace: The coroutine's stack frames
Coroutines can be in one of the following states:
Coroutine state | Description |
|---|---|
| The coroutine is currently executing |
| The coroutine is suspended at a suspension point |
| The coroutine has been created but not yet started |
| The state cannot be determined |