Analyzing Async Calls

The total time of
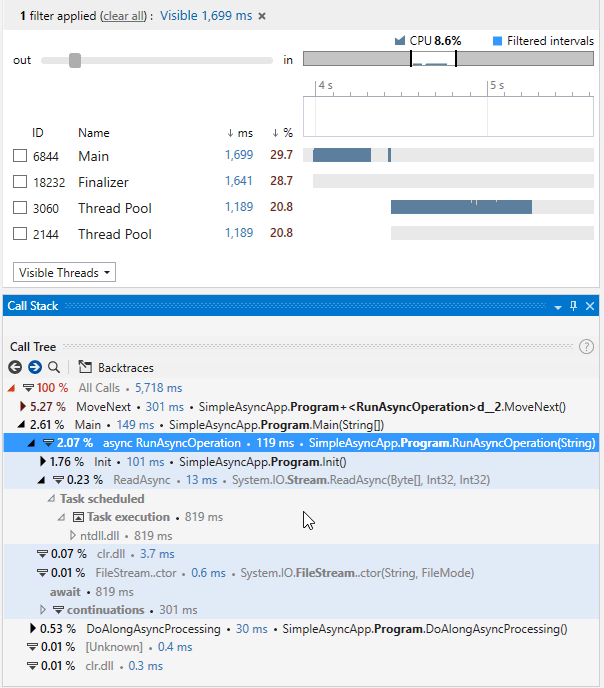
RunAsyncOperationis calculated as119 ms =
Init()101 ms +ReadAsync()13 ms +clr.dll3.7 ms +FileStream.ctor()0.6 msThe
Initmethod (101 ms) is executed on the Main thread, therefore, its time is added to the total time ofRunAsyncOperation.The
ReadAsyncis started on the Main thread (13 ms) but the subsequent task is run on a thread pool. Thus, the time of the Task execution node (819 ms) is shown grey and is not added to the total time ofRunAsyncOperation.
The await time in our case is equal to the Task execution time (819 ms) but in real life it can be higher as it also includes the time the task waits in schedule.
The continuations node is a continuation code which in our case consists of a single
ProcessFilemethod (301 ms). As this call is executed on the thread pool, its time is also shown gray and is not added to the total time ofRunAsyncOperation.
Backtraces of the continuation code

Filtering by async call's total time
Tasks in Call Tree

Asynchronous calls and events
