Optimize your code using profilers
This is a Professional feature: download PyCharm Professional to try.
PyCharm allows running the current run/debug configuration while attaching a Python profiler to it. Note that the UML plugin that is bundled with PyCharm should be enabled.
If you have a yappi profiler installed on your interpreter, PyCharm starts the profiling session with it by default, otherwise it uses the standard cProfile profiler.
Besides these two tracing profilers, PyCharm supports also sampling (statistical) profiler vmprof, which should be installed on the selected Python interpreter. If you are Windows 64 bit user, you have to install Python 32 bit, to make vmprof work. Install 32-bit Python as described on the page Python Releases for Windows.
A profiler runs in the following order: vmprof, yappi, cProfile.
Start the profiling session
Click
 on the main toolbar and select Profile <current run.debug configuration name> or select the same command from Run in the main menu.
Ensure that the profiler has started in the dedicated tab of the Run tool window.

Item Description Saves the profiling results in the <project name>.pstat file for cProfile profiler and the <project name>.prof file for vmprof. Stops the profiler. 
Closes the profiler tab.
Work with the profiling results
On the toolbar of the profiler tab in the Run tool window, click
.
Inspect the profiling results:
cProfilevmprofThe snapshot is saved to the default location under <LOCALAPPDATAPATH>
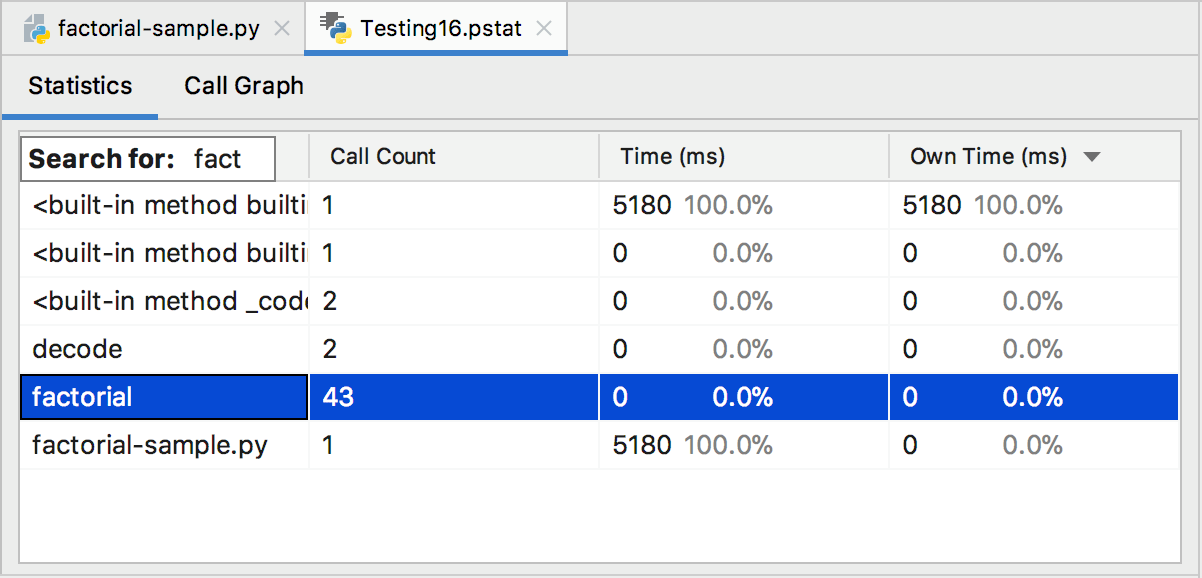
\JetBrains on Windows and ~\<product><version> /snapshots /Library on macOS. For CProfiler, it is saved as <project name>.pstat file. The file opens in the <project name>.pstat tab in the editor, which consists of two tabs: Statistics and Call Graph:/Caches /JetBrains /<product><version> /snapshots 
Item Description Name The name of the function.
Call Count Number of calls of the chosen function. Time Execution time of the chosen function plus all time taken by functions called by this function. The percentage of time spent in this call related to time spent in all calls in the parentheses. Own Time Own execution time of the chosen function. The percentage of own time spent in this call related to overall time spent in this call in the parentheses. Tip: To search for a particular file in the Name column of the Statistics table, click any cell and start typing the target name. The Search field appears in the header of the column so that you can edit the search criteria.
Jump to the source code
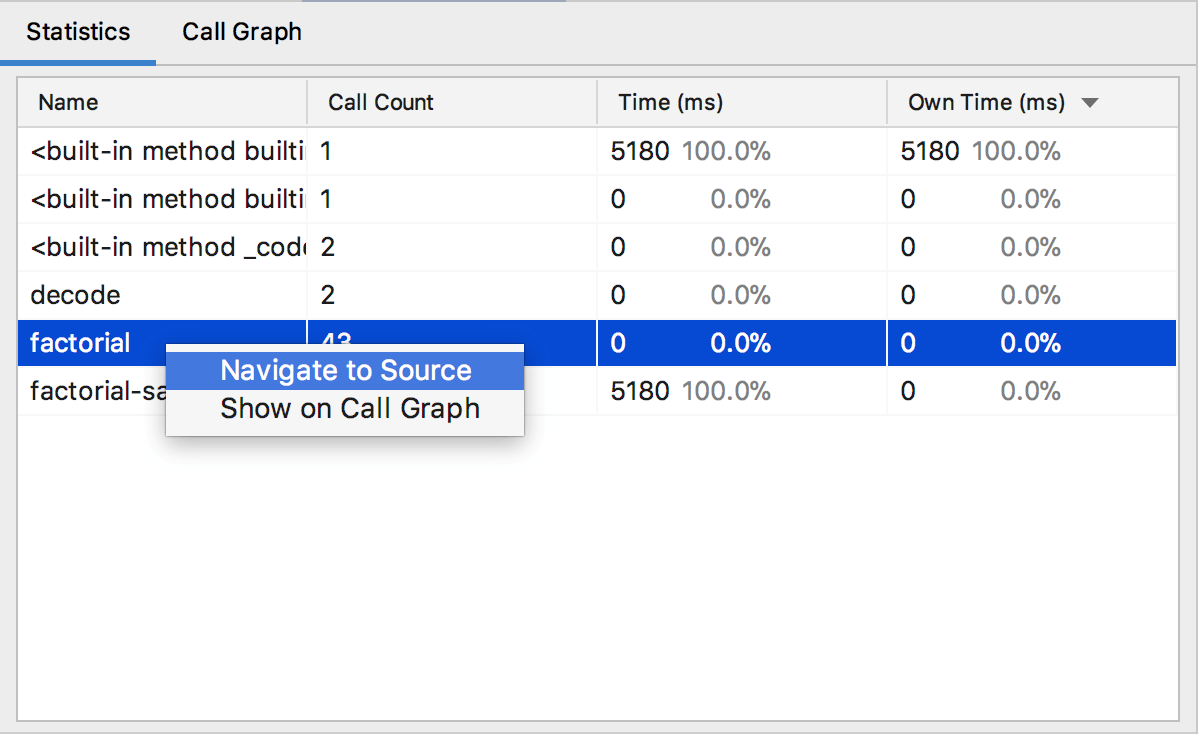
To navigate to the source code of a certain function, right-click the corresponding entry on the Statistics tab, and choose Navigate to Source from the context menu:

The source code of the function opens in the editor.
View the Call Graph
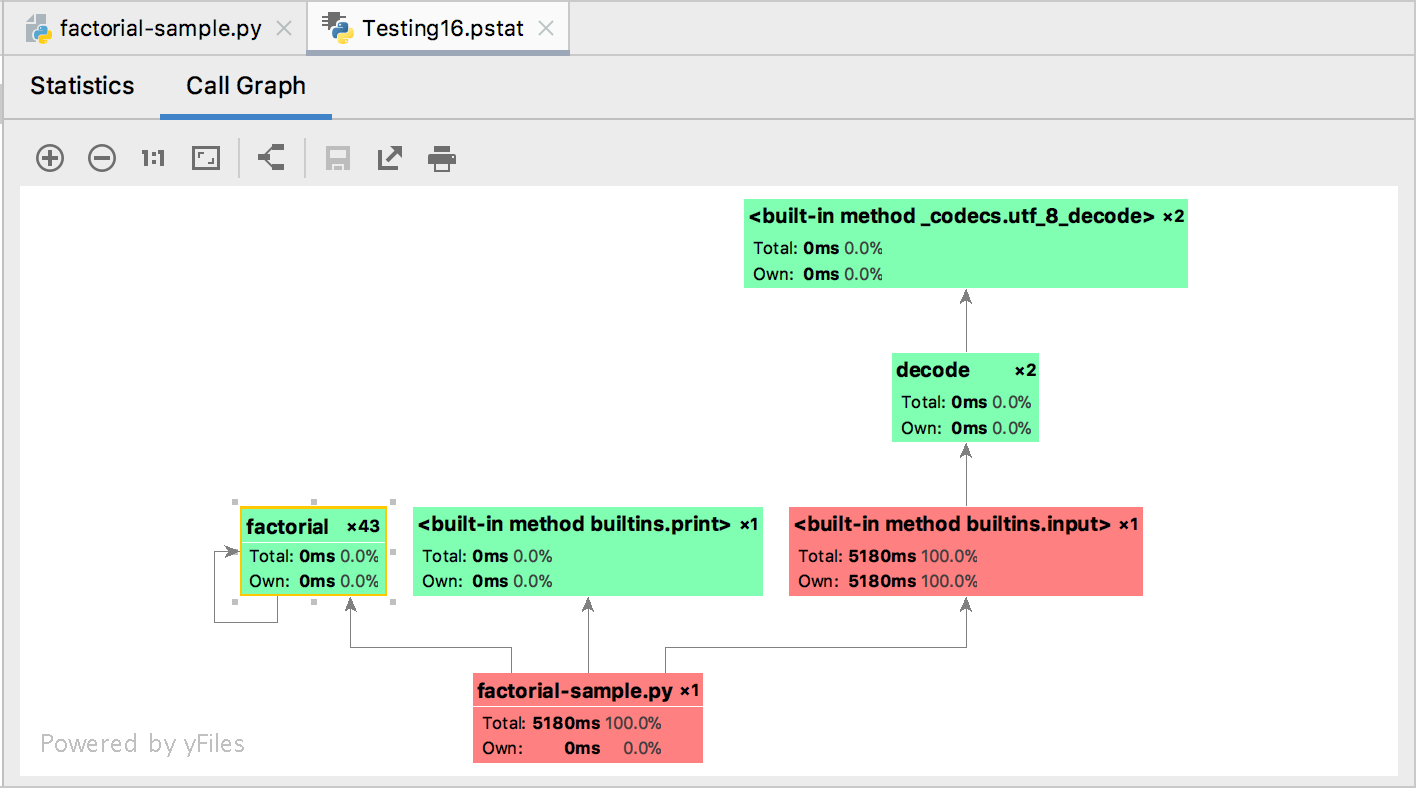
To navigate to the call graph of a certain function, right-click the corresponding entry on the Statistics tab, and choose Show on Call Graph from the context menu.
The Call Graph tab opens with the selected function:

Note the color codes on the Call Graph. The functions marked red consume more time; the fastest functions are green.
Use the toolbar buttons to work with the graph:
Item Description Click this icon to increase the scale of the diagram. Alternatively, press NumPad+. Click this icon to decrease the scale of the diagram. Alternatively, press NumPad-. Click this icon to restore the actual size of the diagram. Click this icon to make the contents fit into the current diagram size. Click this icon to apply the current layout, selected from the diagram context menu. Click this icon to save the current diagram in the specified location as xml file. Click this icon to save the diagram in an image file with the specified name and path. The possible formats are: jpeg, png, svg, svgz, or gif. Click this icon to print the diagram.
Review the existing cProfile snapshots
From the main menu, choose Tools | Open CProfile snapshot.
In the Select PStat file dialog, choose the desired file with the extension pstat.
The profiling results open in the <project name>.pstat tab in the editor.