Start the debugger session
Starting a debugger session is very similar to running the program in normal mode. The debugger is attached behind the scenes, so you don't have to configure anything specific to start a debugger session. If you are able to run your program from PyCharm, you will also be able to debug it using the same configuration.
note
This topic relies on your understanding of run/debug configurations. While PyCharm provides a way to debug simple applications without any extra setup, understanding run/debug configurations is essential to efficient use of the debugger. More on them here.
Each time you debug a program, the debugger session is based on a run/debug configuration. Thus, you can configure PyCharm to use any parameters and perform any actions before the program is launched. For example, the configuration can build the application every time you start a debugger session or use the previously compiled code. You can also use any VM options, custom classpath values and so on (as long as the selected run/debug configuration supports this).
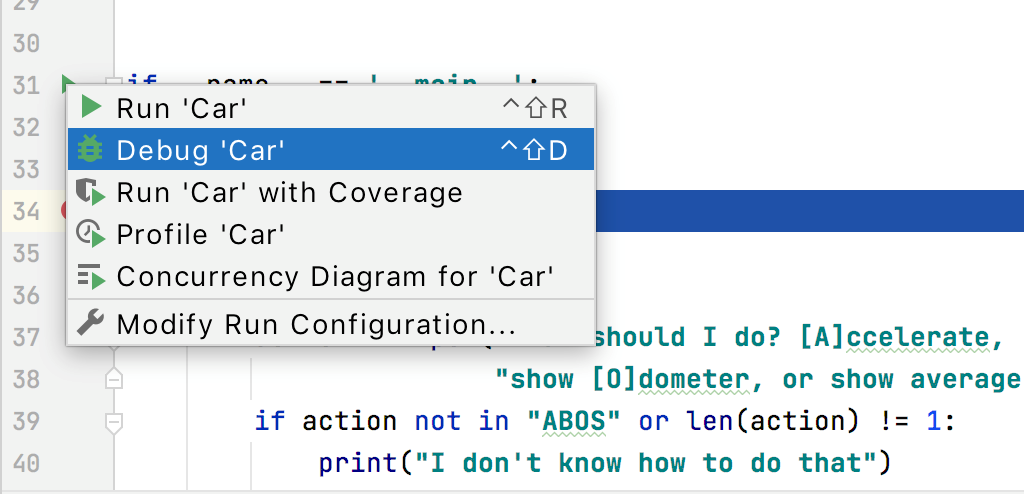
If you don't have a run/debug configuration, and your program doesn't require you to have one, click the Run
icon in the gutter near the class with the
main()method and select Debug. This will create a temporary run/debug configuration for you. After that, you can customize and save this temporary configuration if needed. This is the quickest way to debug your program from an entry point that has not been defined yet.
tip
To quickly set up a run/debug configuration, place the caret at the declaration of the executable class or its main method, press Alt+Enter and select Edit.
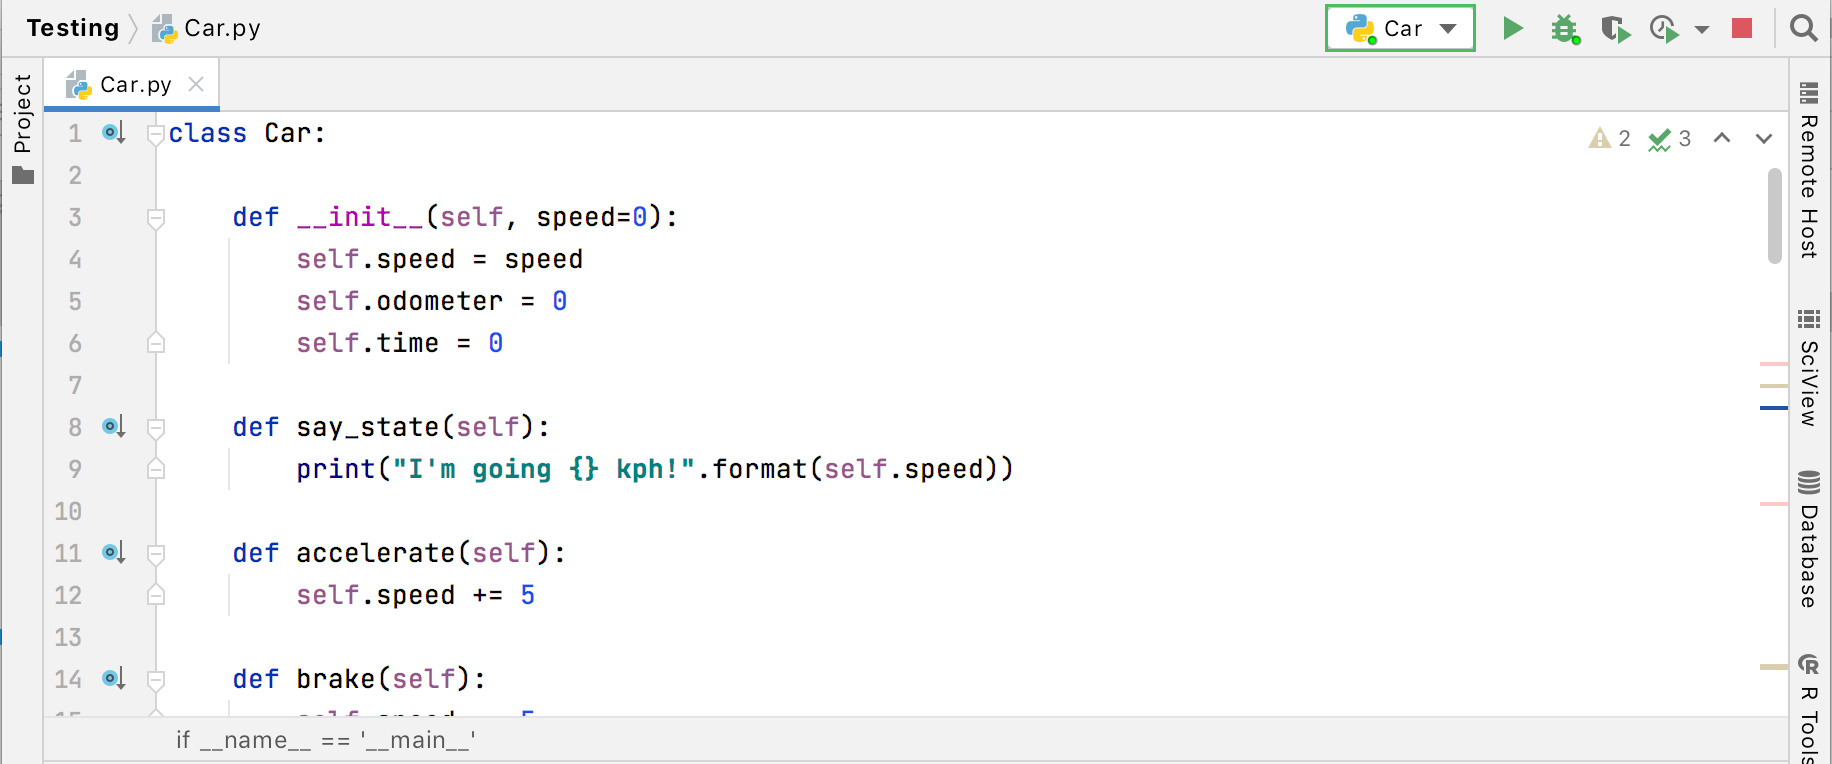
If you already have a run/debug configuration, and it is currently selected in the run/debug configurations list, press Shift+F9.

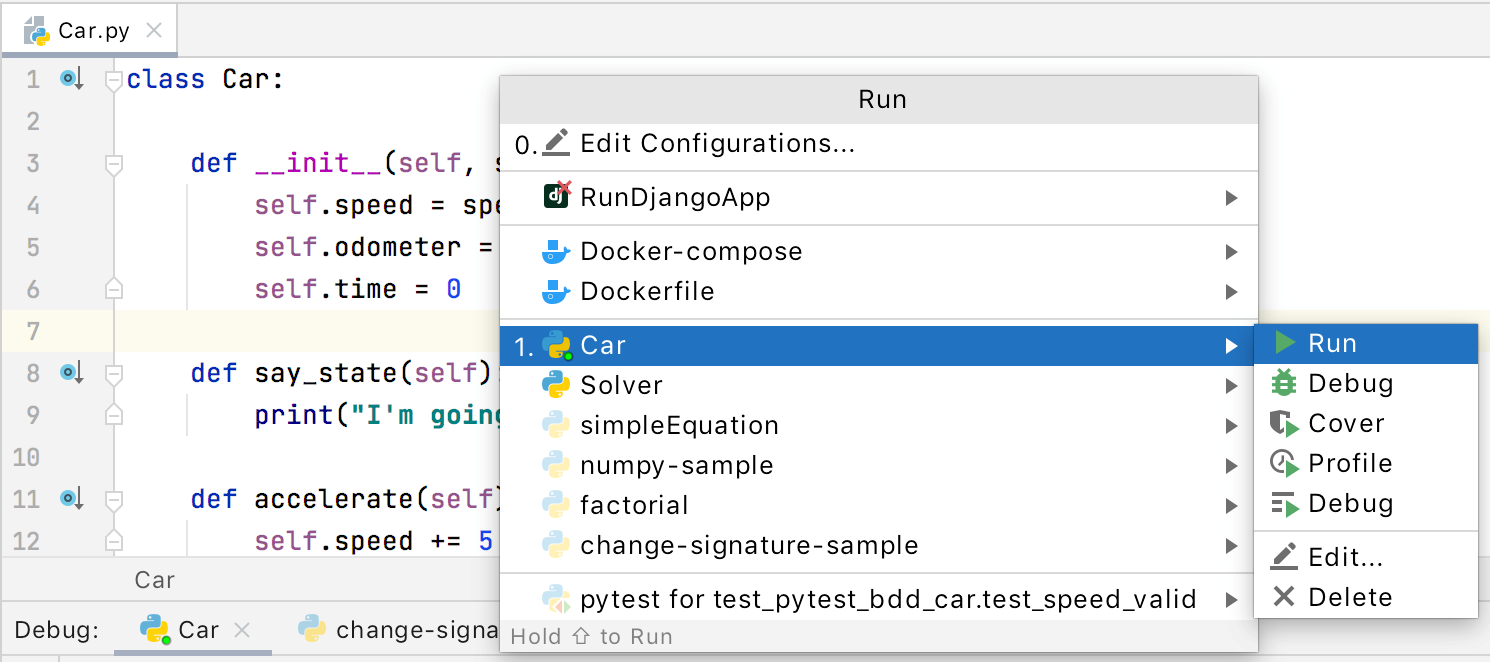
If you already have a run/debug configuration, and it is not selected, or you want to adjust some configuration before debugging, press Alt+Shift+F9. After that, select the desired configuration or proceed with Edit Configurations.

Pause/Resume a debugger session
When the debugger session is running, you can pause/resume it as required using the buttons on the toolbar of the Debug tool window:
To pause a debugger session, click
.
To resume a debugger session, click
F9.
note
Pausing the program manually is not an alternative to using breakpoints as this method doesn't let you use the full range of debugger functionality. For example, you cannot evaluate expressions after pausing the program.
Restart a debugger session
Click the Rerun button in the Debug tool window or press Ctrl+F5.

Terminate a debugger session
Click the Stop button in the Debug tool window. Alternatively, press Ctrl+F2 and select the process to terminate (if there are two or more of them).
Productivity tips
- Debug non-responding applications
- In case your application hung, pause the session to let the debugger get the information about its current state. You can then examine the program state and locate the cause of the problem.
- Do more with pause
- When you need to evaluate an expression, and PyCharm doesn't let you do that because you didn't stop at a breakpoint, you can advance your program a line further by stepping. After this, you will be able to use the debugger as if you had stopped at a breakpoint. While in some cases this may not be a valid solution, it may sometimes help you out.
- Run before-launch tasks
- Configure running external tools or performing other actions before every debugging session. This before-launch task can be running a Gulp or Grunt task or an NPM script, compiling your TypeScript code into JavaScript or running all the currently active File Watchers to compile or compress your code, uploading your sources to a remote server, and many more, depending on the language and frameworks you are using.