Start the debugger session
Starting a debugger session is very similar to running the program in normal mode. The debugger is attached behind the scenes, so you don't have to configure anything specific to start a debugger session. If you are able to run your program from RustRover, you will also be able to debug it using the same configuration.
Any debugger session is based on a run/debug configuration. The configuration type depends on the type of your application and the runtime environment.
Click
 next to the desired entry point and select Debug.
This will create a temporary run/debug configuration for you. After that, you can customize and save this temporary configuration if needed.
If you already have a run/debug configuration, select it from the run/debug configurations list and click the
 button or press Shift+F9.
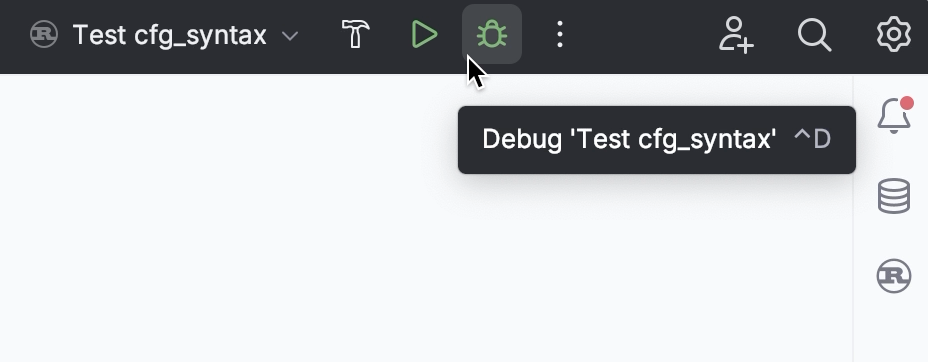
Pause/Resume a debugger session
When the debugger session is running, you can pause/resume it using the buttons on the toolbar of the Debug tool window:
To pause a debugger session, click
 .
.To resume a debugger session, click
 F9.
F9.
Restart a debugger session
Click the
 Rerun button in the Debug tool window or press Ctrl+F5.
Terminate a debugger session
Click
 in the Debug tool window.
Alternatively, press Ctrl+F2 and select the process to terminate (if there are two or more of them).
Debug multiple tasks
To run or debug multiple tasks simultaneously, open the run widget menu in the toolbar and select the corresponding run/debug configurations while holding down the Ctrl key.
