The Remote GDB Server configuration
Local OS: macOS / Linux / Windows
Remote OS: any supporting gdbserver, SSH, and SFTP
Required tool: gdbserver on tagret
Binary file synchronization: automatic
Client debugger: bundled GDB / toolchain's GDB / custom GDB
Build targets: CMake / Makefile / custom build target
The Remote GDB Server configuration builds your target locally, uploads the binary to the remote machine, launches it under gdbserver, and connects the CLion debugger.
In the main menu, go to Run | Edit Configurations, click
, and select Remote GDB Server from the list of templates.
Specify the following settings:

Target and Executable
Select the target to be built (CMake, Makefile, or custom target) and the executable to be uploaded remotely.
Click the
button to configure custom targets in the Settings | Build, Execution, Deployment | Custom Build Targets dialog.
GDB
Select the client debugger: bundled multiarch GDB (default), one of the toolchain debuggers, or a custom GDB binary.
Credentials
Select one of the existing SSH configurations from the drop-down list or click
to create a new one. Provide the credentials for accessing your remote machine:

tip
You can also manage SSH configurations in Settings | Tools | SSH Configurations.
Upload executable
Your executable can be uploaded every time you start a debug session (Always) or upon the changes in the binary (Updated Only). You can also choose to skip uploading (None).
Upload path
Specify the remote folder where the executable will be placed.
'target remote' args
Provide the medium to carry debugging packets (serial line or an IP network using TCP or UDP). See gdb documentation for more details on connecting to a remote target.
GDB Server
Set the location of gdbserver on the remote machine. The default path is filled up automatically.
GDB Server args
Specify the arguments that will be passed to gdbserver: connection port, executable path, and additional arguments if required.
By default, this field contains the port you provided in 'target remote' args and the path from Upload path followed by the binary name.
note
By default for CMake projects, this configuration builds your target using the currently selected CMake profile and takes the binary from the Build directory folder.
If your setup requires a cross-compiler toolchain, make sure to create it, configure a corresponding Debug profile, and switch to this profile before you start a session.
Make sure to select GDB as your toolchain debugger.
On macOS and Linux, go to Settings | Build, Execution, Deployment | Toolchains and select one of the available GDB options in the Debugger field of the current toolchain.
Note that on Windows, Remote GDB Server configurations can't be used with the Visual Studio toolchain since the debugger it employs is based on LLDB.
tip
Make sure your system's firewall allows connection to the remote GDB server.
After placing breakpoints in your code, select the newly created Remote GDB Server configuration, and press
().
You can find the build log in the Messages tool window:

To monitor the process of uploading, switch to the File transfer window:

The Console tab of the Debug tool window shows the status of the GDB/gdbserver connection:

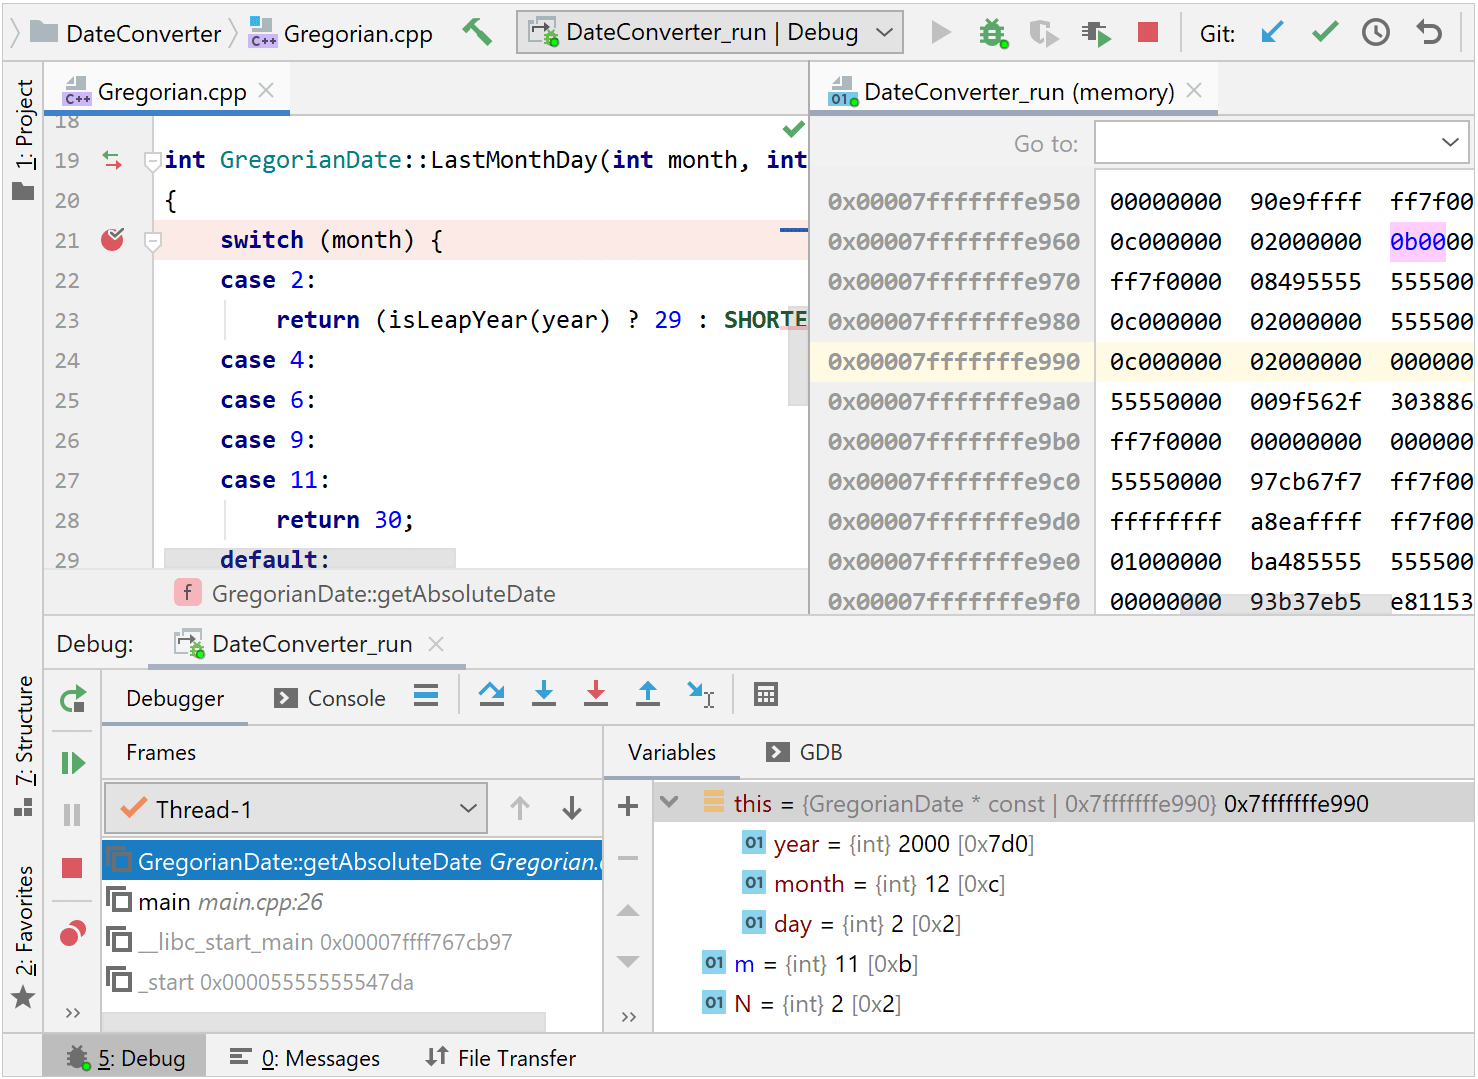
You can debug the program as usual: examine the variables, step through, evaluate expressions, and use all the other debug features.
