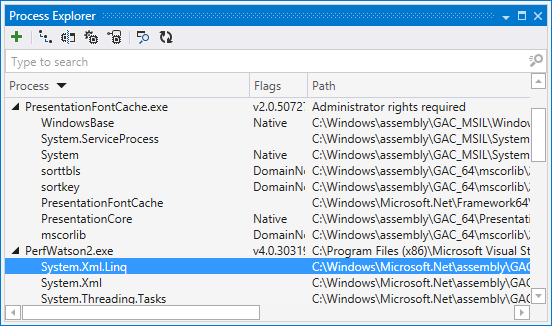
Explore assemblies from current processes
Windows | Process Explorer
Using the dotPeek's Process Explorer window, you can explore current processes and the loaded assemblies. The processes are displayed with the corresponding assemblies and can be sorted and grouped. If necessary, you can show or hide native processes.
Having all the loaded assemblies in view, you can easily find the ones you want to decompile and explore.

Do one of the following:
Choose Windows | Process Explorer in the main menu.
On the toolbar of the Assembly Explorer window, click Open from Running Process
.png) .
.
In the Process Explorer window, do one of the following:
Expand the process you want to explore and select the desired assemblies.
Click Find Process by Window
.png) and then hover over a window, whose process you want to explore:
and then hover over a window, whose process you want to explore:
In the tooltip, you could see the PID and the CLR version. and the process is highlighted in the Process Explorer window.
When the desired assemblies are selected, click Add Assembly to Assembly Explorer
.png) . The assemblies appear in the Assembly Explorer window and can be decompiled.
. The assemblies appear in the Assembly Explorer window and can be decompiled.
tip
If at any point you would like to clear the decompilation cache, remove the data in %LOCALAPPDATA%
\JetBrains .\Shared \vAny \DecompilerCache