Explore PDB contents
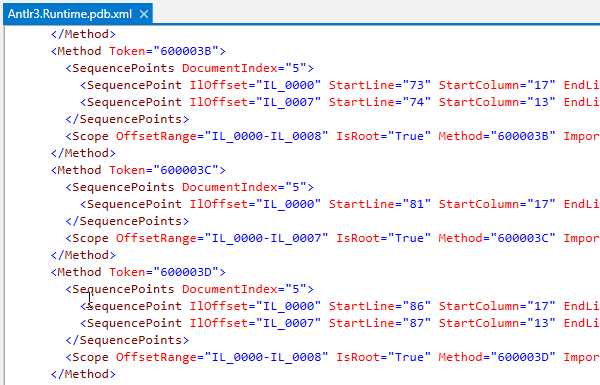
dotPeek helps you explore assembly PDB contents by generating a readable XML file, which contains:
source file names,
mapping between IL offsets and source lines,
names of local variables,
entry point method if present,
import scopes,
a type of PDB file (Windows/Portable/Embedded),
PDB signature,
source server info: SourceLink/SrcSrv.
To study PDB contents associated with an assembly, right-click it in the Assembly Explorer window and choose Show PDB content. dotPeek will generate an XML file and open it in the code viewer.
You can also analyze any PDB file in a readable XML format, even if there is no related assembly. To do so, choose from the menu and then select a .pdb file.

11 February 2024