Debug tool window
Show/hide: View | Tool Windows | Debug or Alt+5
Configure: Settings/Preferences | Build, Execution, Deployment | Debugger
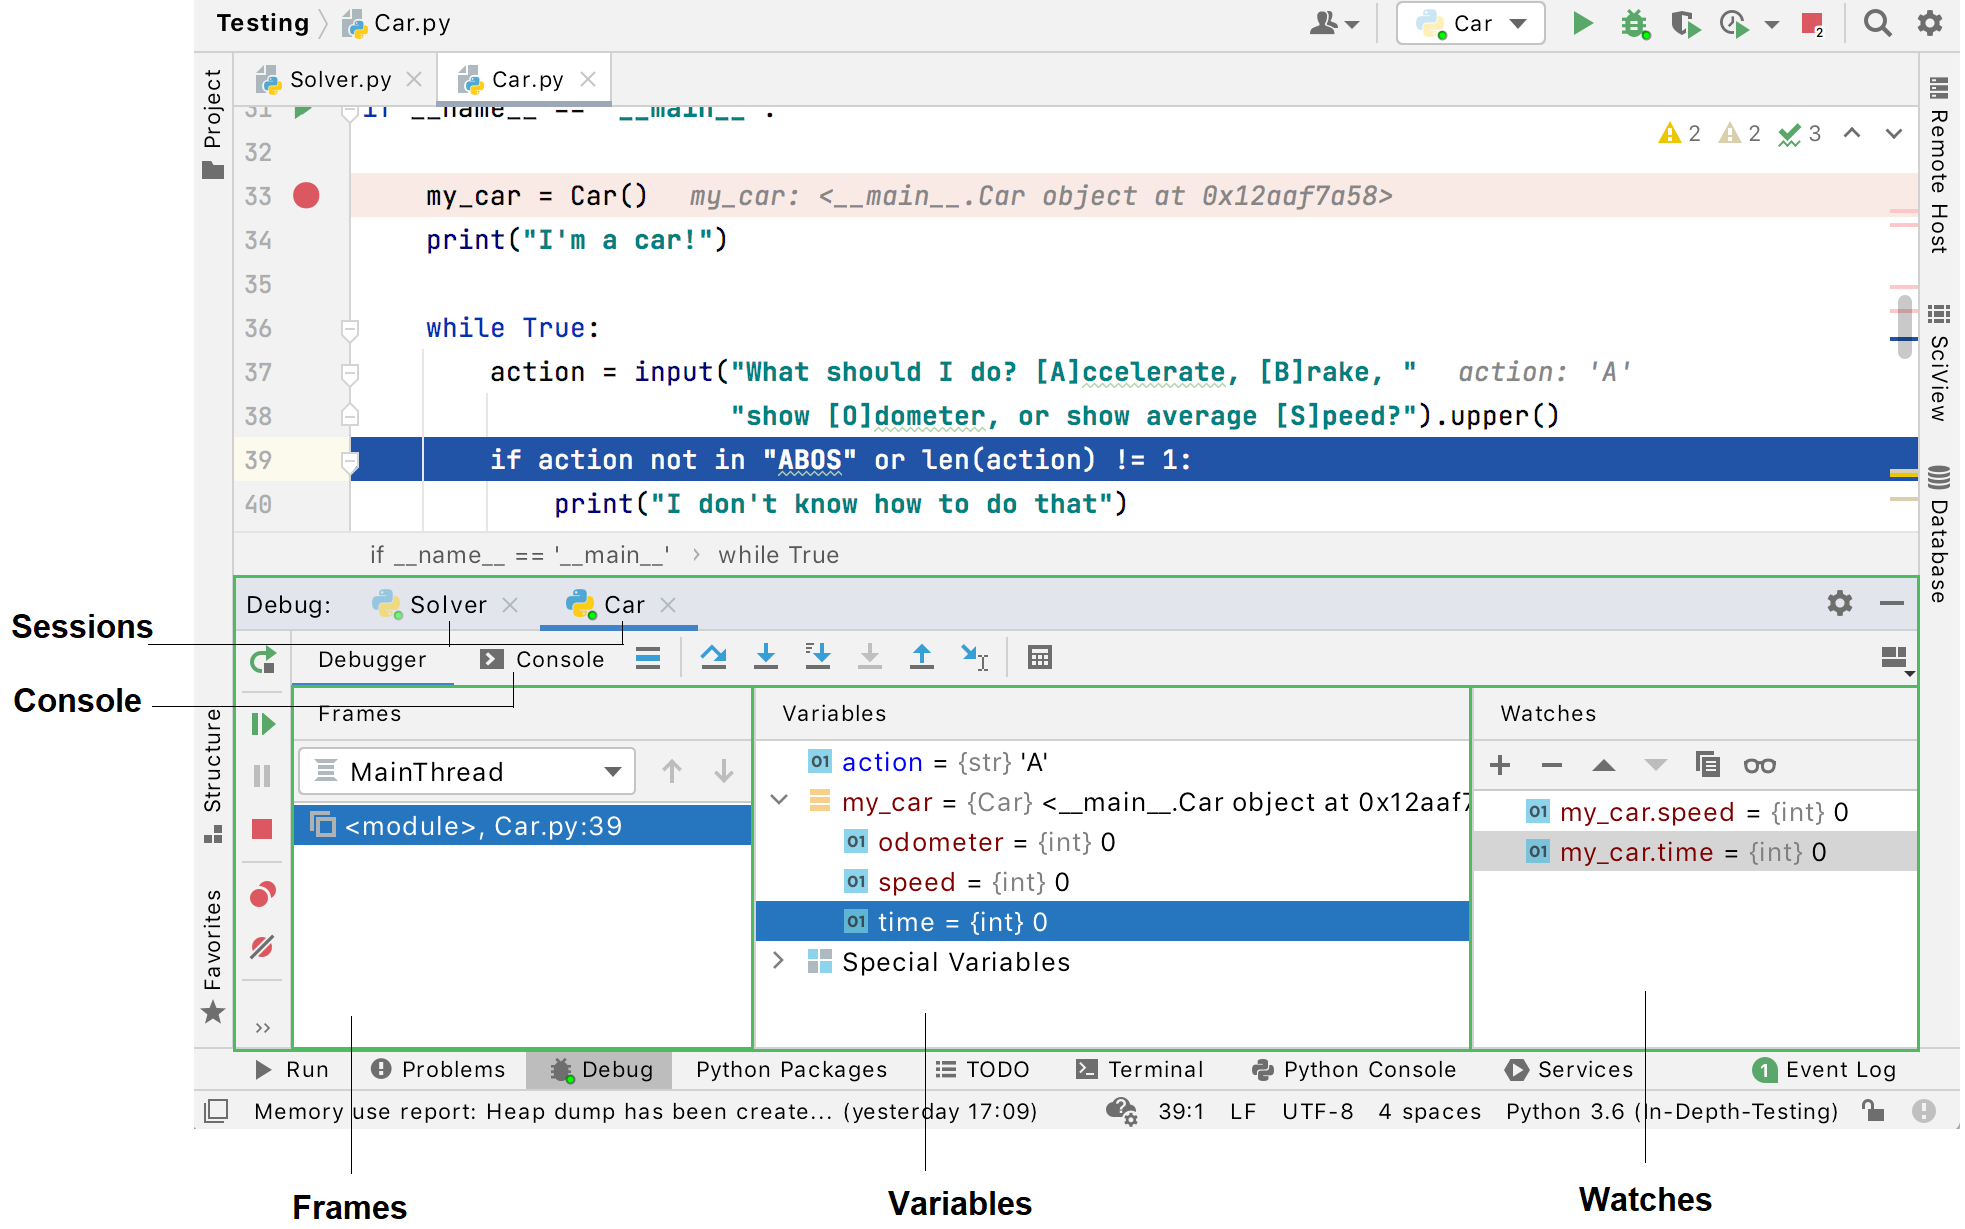
When you start a debugger session, the Debug tool window appears. Use this window to control the debugger session, display and analyze the program data (frames, variables, and so on), and perform various debugger actions.
This is a brief overview of the Debug tool window. For general instructions on using tool windows, refer to Tool windows.

tip
By default, the Debug tool window opens when your program hits a breakpoint and is not hidden when the session is terminated. To change this behavior, clear the Show debug window on breakpoint checkbox on the Build, Execution, Deployment | Debugger page of the IDE settings Ctrl+Alt+S.
Sessions
The available debug sessions are separated into tabs in the top part of the Debug tool window.

If you enable Services window for specific run/debug configurations, the entire view of the Debug window will be displayed inside the Services window when you debug any of these configurations.
All the information like inline variable values and execution point is shown for the selected session tab. This is important if you are running several debug sessions in parallel that use the same.
note
When you close a tab, the corresponding session terminates.
Tabs
Debug tool window shows the following tabs for each session:
Frames: lets you navigate in call stacks of the threads.
Variables: lists the variables available in the current context and lets you analyze and modify the program state.
Watches: lets you manage watches. By default, watches are shown on the Variables tab for more efficient use of the screen space. If you have a lot of watches, consider viewing them in a separate tab.
Console: displays the program output.
For local sessions, the tab works the same as when you just run the program without the debugger attached. The only difference is that debugger output (for example, log messages from breakpoints) is added to the console.
When you attach to a process, the program output is not redirected and only the debugger output is shown in the debugger console.
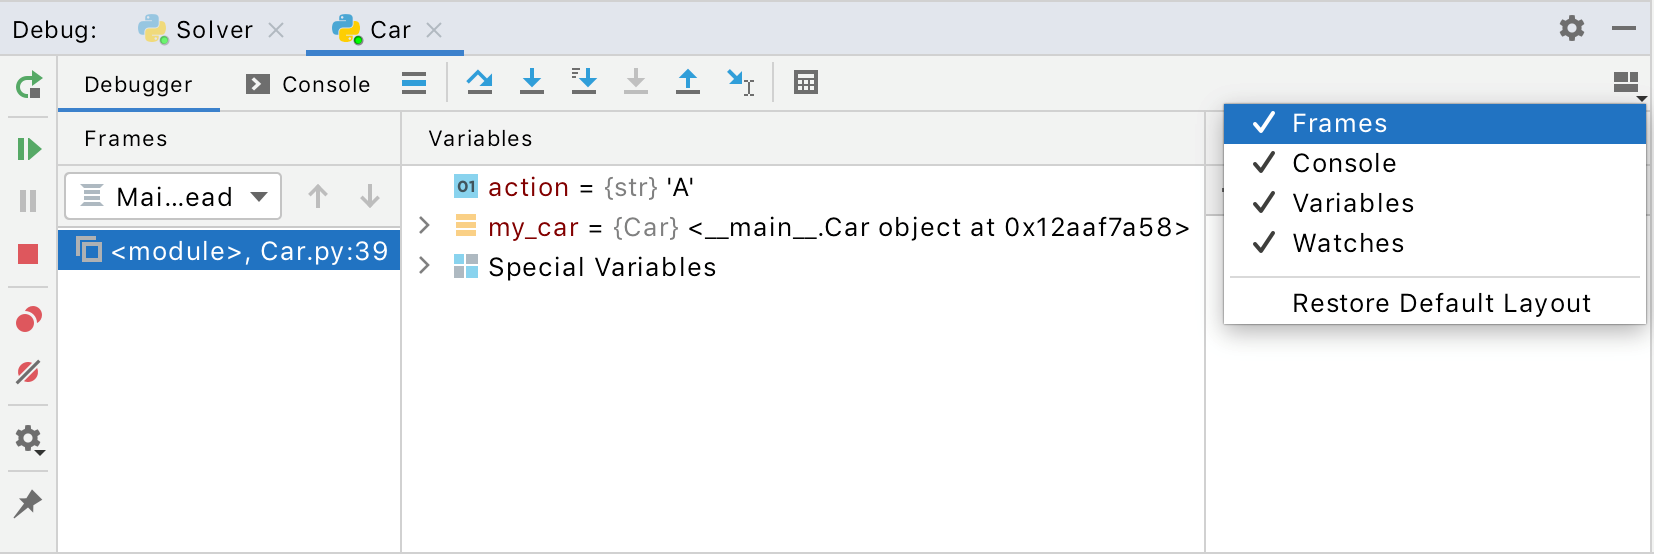
Show/hide tabs
Click
and select which tabs you want to see.

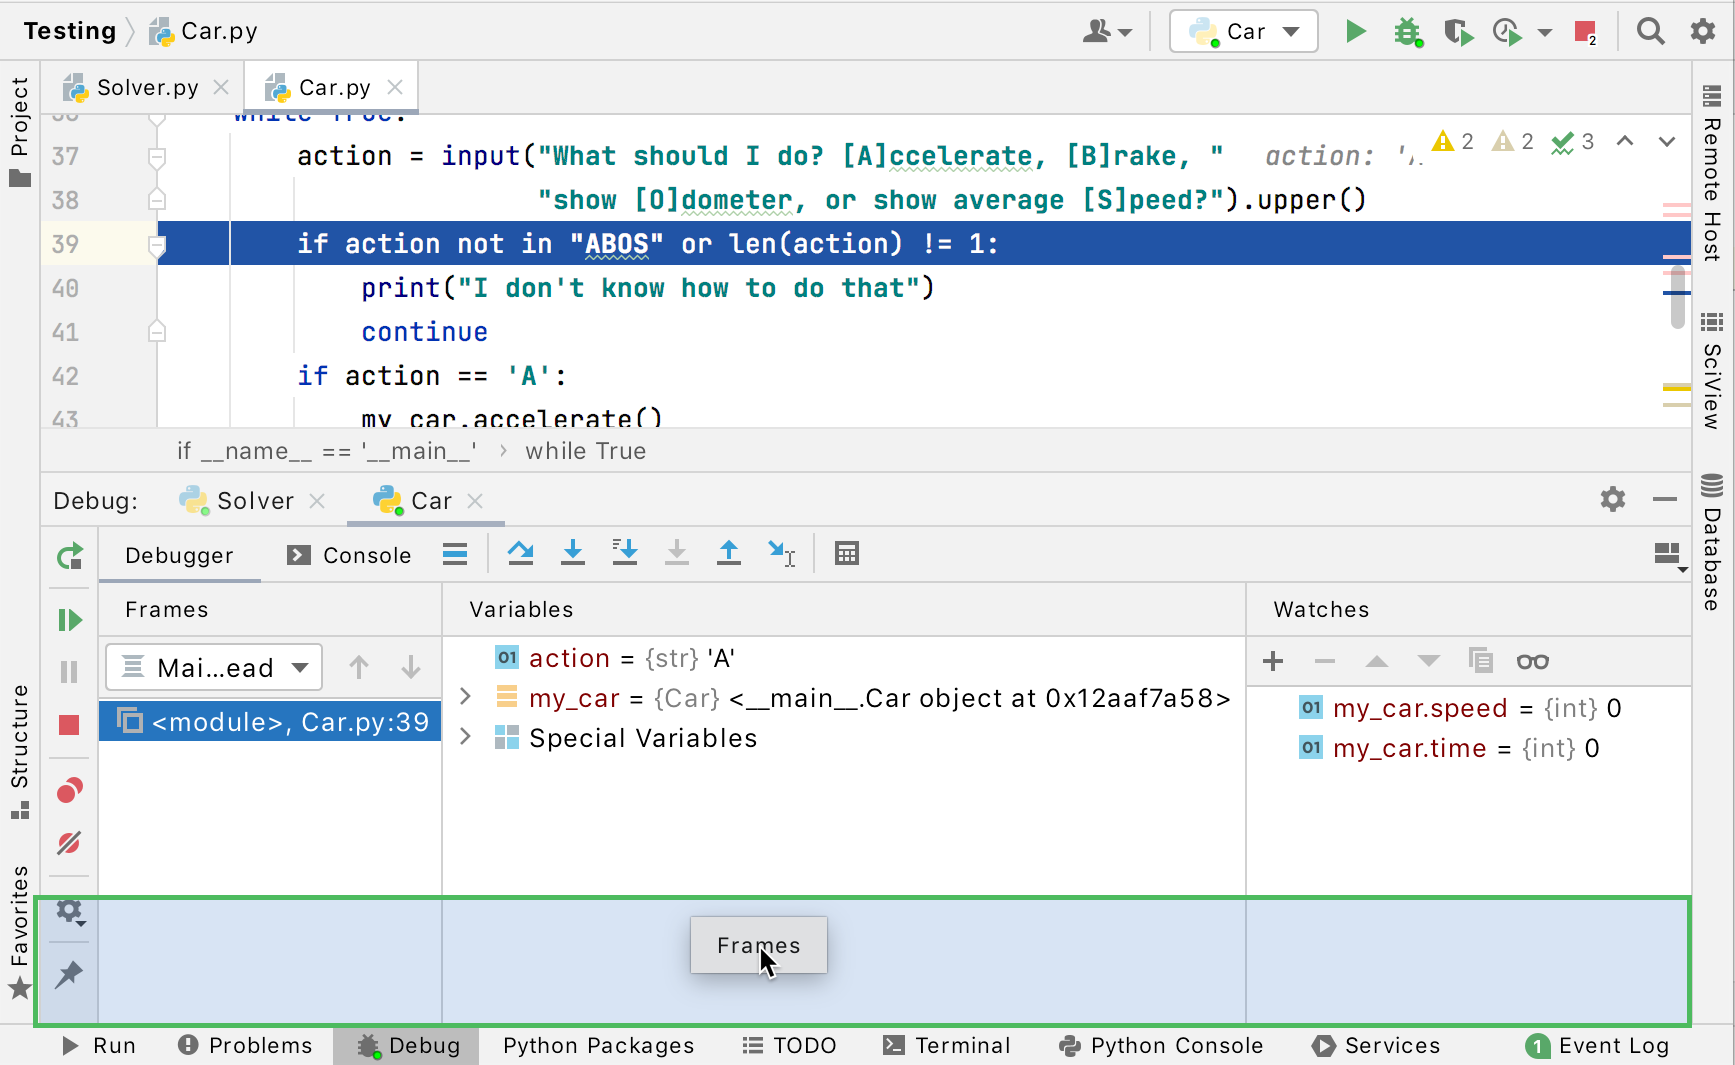
Move tabs
You can arrange the tabs to fit your preference. You can move a tab to another location or group a tab with another tab, so that they share the same space on the screen.
Drag the tab header to the desired location. The blue frame indicates the destination.

Restore default layout
If you changed the layout of the Debug tool window and don't like the new arrangement, you can revert it to the default state.
Click
in the top-right corner of the Debug tool window, then click Restore Default Layout.
Debug toolbar
Regardless of the selected tab, you can always use the following toolbar controls in the left part of the window:
| Item | Tooltip and Shortcut | Description |
|---|---|---|
| Rerun Ctrl+F5 | Click this button to stop the current application and run it again. | |
| Resume Program F9 | When an application is paused, click this button to resume program execution. | |
| Pause Program Ctrl+Pause | Click this button to pause program execution. | |
| Stop Ctrl+F2 | Click this button to terminate the current process externally by means of the standard shutdown script. | |
| View Breakpoints Ctrl+Shift+F8 | Click this button to open the Breakpoints dialog where you can configure breakpoints behavior. | |
| Mute Breakpoints | Use this button to toggle breakpoints status. When the You can temporarily mute all the breakpoints in a project to execute the program without stopping at breakpoints. | |
| Settings | Click this button to open the menu with the following options:
| |
| Pin Tab | Click this button to pin or unpin the current tab. You may need to pin a tab to prevent it from closing automatically when the maximum number of tabs is reached in this window. |
Stepping toolbar
| Item | Tooltip and Shortcut | Description |
|---|---|---|
| Show Execution Point Alt+F10 | Click this button to highlight the current execution point in the editor and show the corresponding stack frame in the Frames pane. | |
| Step Over F8 | Click this button to execute the program until the next line in the current method or file, skipping the methods referenced at the current execution point (if any). If the current line is the last one in the method, execution steps to the line executed right after this method. | |
| Step Into F7 | Click this button to have the debugger step into the method called at the current execution point. | |
| Force Step Into Alt+Shift+F7 | Click this button to have the debugger step into the method called in the current execution point even if this method is to be skipped. | |
| Step Into My Code Alt+Shift+F7 | Click this button to skip stepping into library sources and keep focused on your own code. | |
| Step Out Shift+F8 | Click this button to have the debugger step out of the current method, to the line executed right after it. | |
| Run to Cursor Alt+F9 | Click this button to resume program execution and pause until the execution point reaches the line at the current cursor location in the editor. No breakpoint is required. Actually, there is a temporary breakpoint set for the current line at the caret, which is removed once program execution is paused. Thus, if the caret is positioned at the line which has already been executed, the program will be just resumed for further execution, because there is no way to roll back to previous breakpoints. This action is especially useful when you have stepped deep into the methods sequence and need to step out of several methods at once. If there are breakpoints set for the lines that should be executed before bringing you to the specified line, the debugger will pause at the first encountered breakpoint.
| |
| Evaluate Expression Alt+F8 | Click this button to. evaluate expressions. |