Debugging
note
Rider's debugger does not support the following types of applications:
Single-file applications — applications that were built with the
/p:PublishSingleFile=trueflag.Native applications that host CLR to run .NET code. For example, applications that use CLR Hosting.
Define a run/debug configuration for the program that you want to debug.
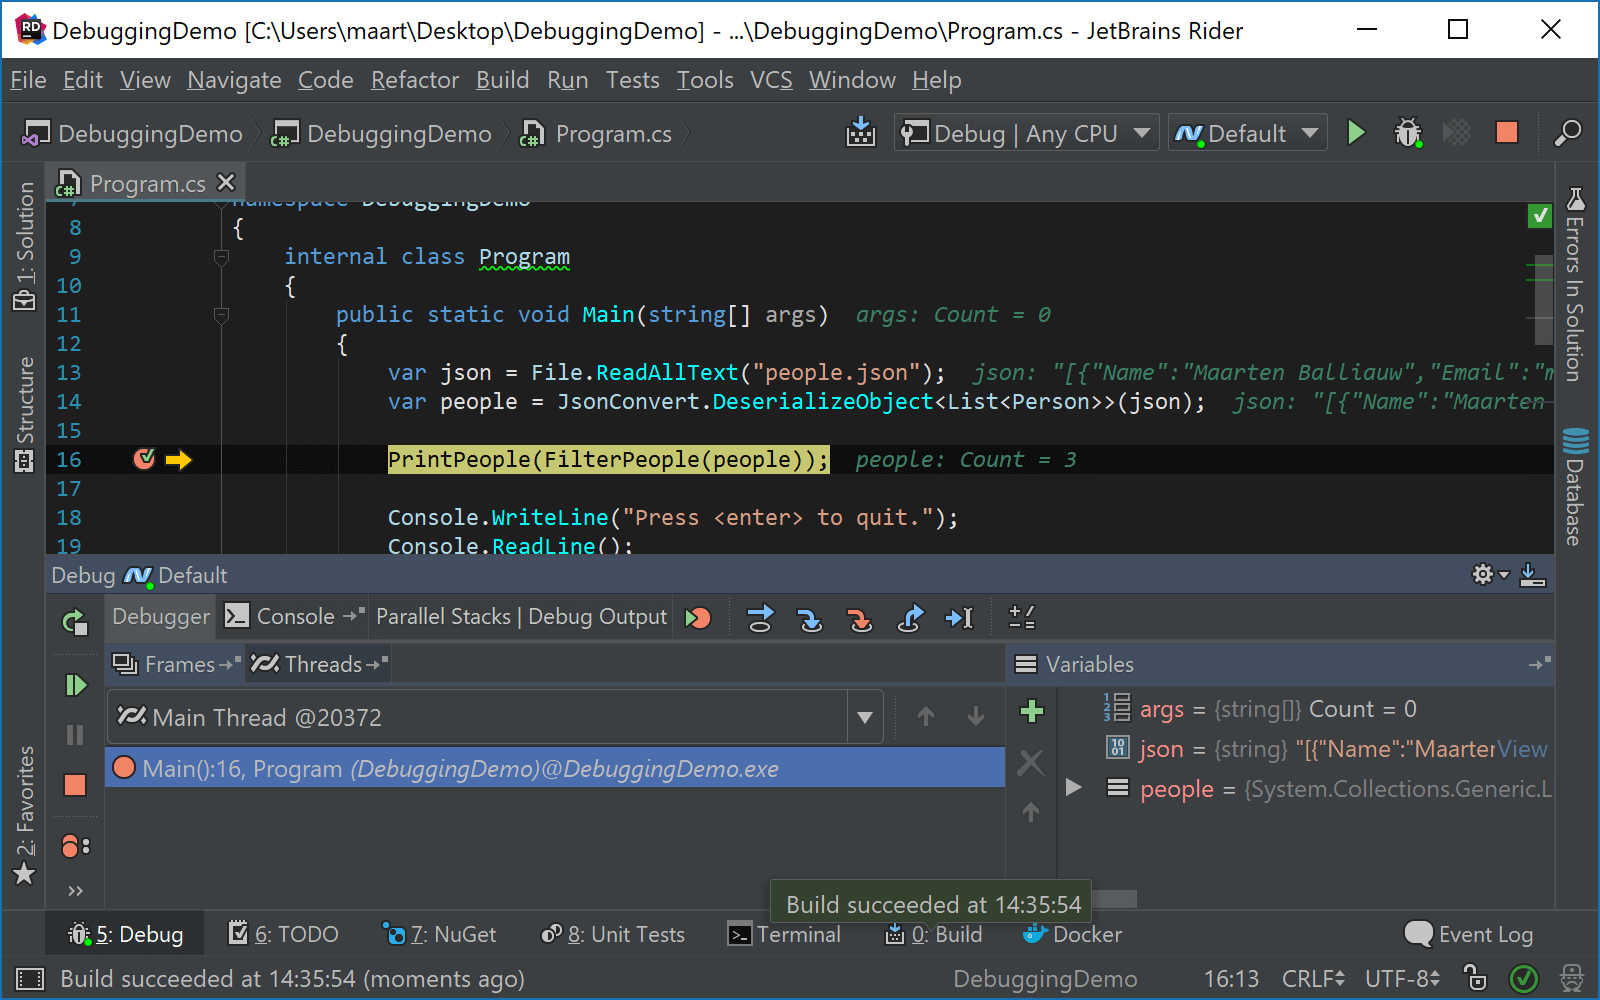
Set breakpoints in the source code where the potential problem may lie.
Start debugging by launching your program in the debug mode AltF5 or attaching to a running process CtrlAlt0P.
When the program execution breaks, step through your code, inspect variables, and evaluate expressions.
You can edit the code of a suspended program and then continue debugging without restarting with Hot Reload.
Resume the debugging session F5 to let the program run to the next breakpoint, if any.
To finish the debugging session, press ShiftF5, select in the menu, or click Stop
 in the Debug window.