Code hierarchies
In addition to code analysis, JetBrains Rider's code analysis allows you to investigate members by building call chains and value chains.
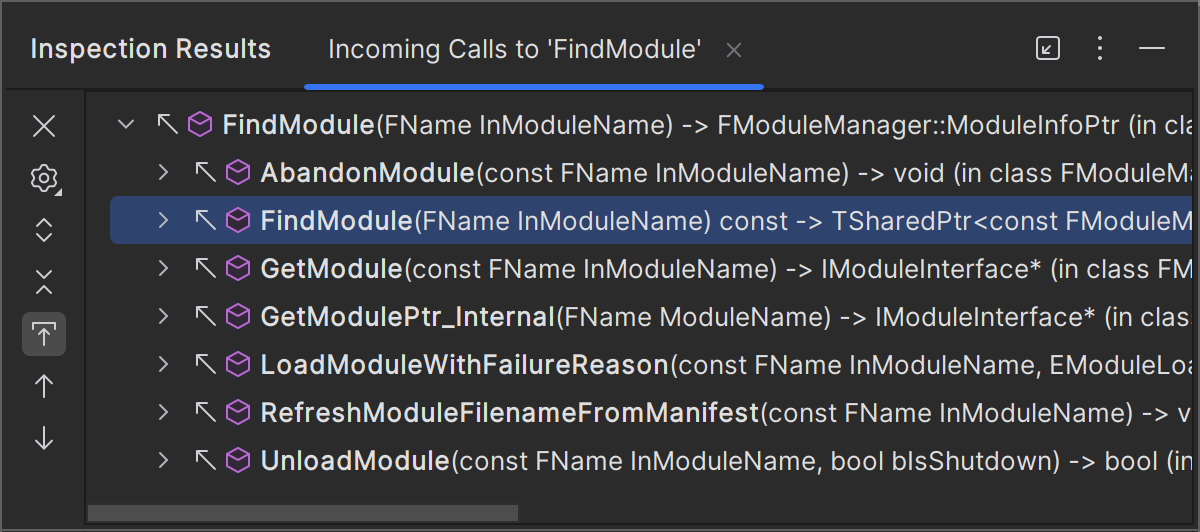
Call hierarchy shows callers (supertypes) or callees (subtypes) of a function.
To explore incoming calls, place the caret at any function. Press CtrlAltShift0A and choose Incoming Calls in the Inspect This list.
To explore outgoing calls, place the caret at any function. Press CtrlAltShift0A and choose Outgoing Calls in the Inspect This list.

In the call tracking results window, you can double-click the hierarchy entry to navigate to the corresponding call in the editor or expand any node to check out their incoming/outgoing calls.
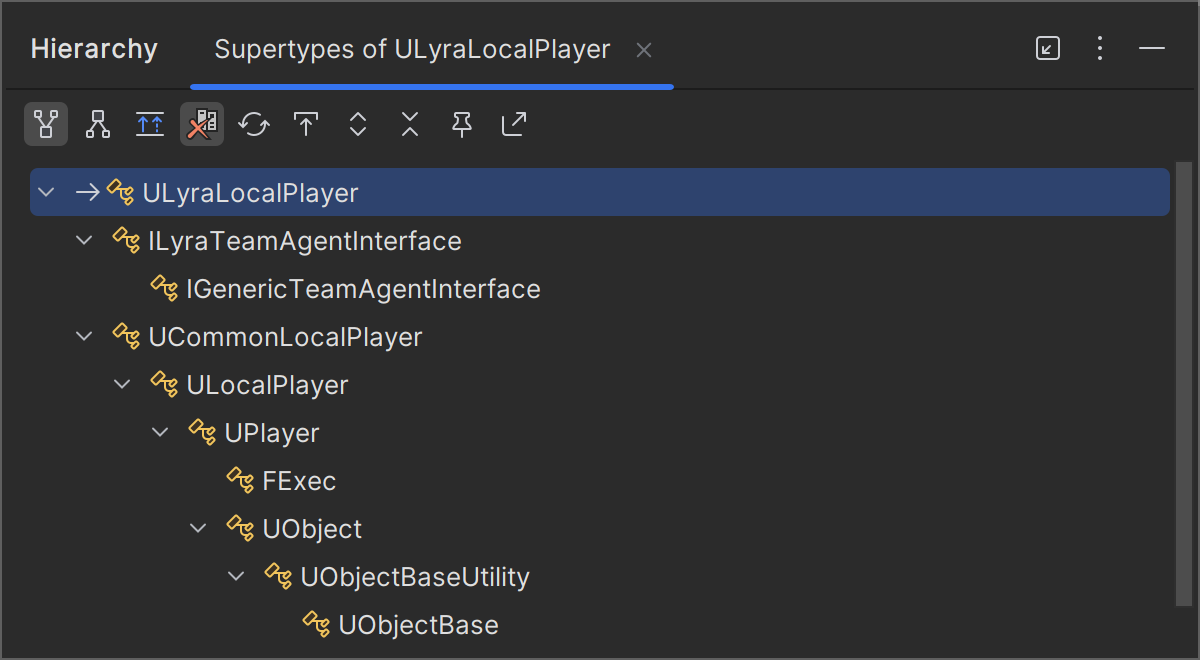
With JetBrains Rider, you can investigate the inheritance hierarchy of types from your solution and from referenced libraries. You can see both base types and inheritors of the selected type and navigate to any of them with a mouse click. For more information, refer to Explore type hierarchy.

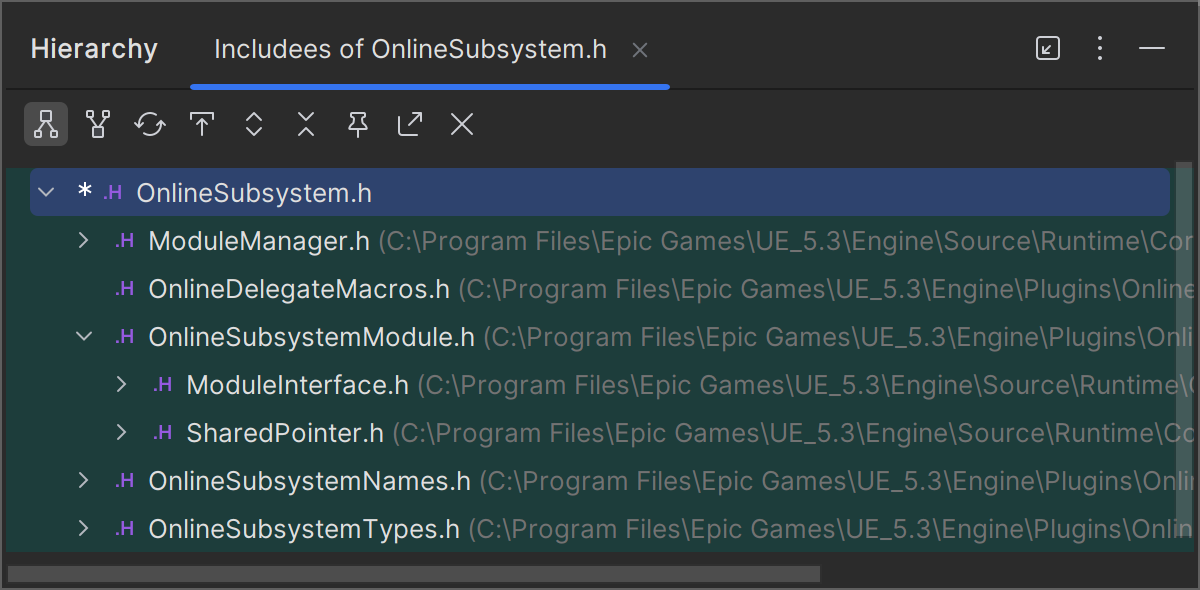
JetBrains Rider allows you to visually analyze the hierarchy of includes for a single include directive or for a file.
To build the hierarchy of includes, place the caret to an #include directive in a file or select a file in the Solution Explorer, and then press Ctrl0E,0H or choose Navigate | Type Hierarchy from the menu.

You can double-click any file in the hierarchy to open it in the editor.
By default, child nodes of each file represent files included in this file, which corresponds to the Includee ![]() mode on the toolbar. You can switch to the Includers
mode on the toolbar. You can switch to the Includers ![]() mode. In this mode, child nodes of a file represent files in the current scope that include this file.
mode. In this mode, child nodes of a file represent files in the current scope that include this file.