Debugger
Use this page to configure the behavior of the Debugger and customize its view.
Common options
Item | Description |
|---|---|
Show debug window on breakpoint | If this checkbox is selected, JetBrains Rider activates the Debug window on hitting a breakpoint. |
Focus application on breakpoint | If this checkbox is selected, on hitting a breakpoint, JetBrains Rider will show the location of this breakpoint in the editor and will attempt to bring its frame to the front. |
Focus target process after resume | If this checkbox is selected, the window of the debugged process will be shown on top of all other windows if there is no interaction with the debugger from the debugged process within 1 second after resuming the debugger. |
Hide debug window on process termination | Automatically hide the Debug window when the debugged program terminates. |
Scroll execution point to center | If this checkbox is selected, the line with the current execution point will be kept in the middle of the screen. |
Click line number to perform run to cursor | If this checkbox is selected, you can click a line number in the editor to run program execution to this line.  |
Remove breakpoint | Select how you want to remove breakpoints:
You can also choose whether you want a confirmation dialog to be displayed when you are about to remove a conditional or a logging breakpoint |
All Languages
Item | Description |
|---|---|
Allow editing in the debug mode | This checkbox only affects files of non-.NET languages (for example, JavaScript or TypeScript files). In .NET languages, you can use Hot Reload, which is configured on the Build, Execution, Deployment | Hot Reload settings page Ctrl+Alt+S. The checkbox is disabled by default because when you edit code in the debug mode, it is no longer synchronized with the debugger and can lead to unexpected results. If Show prompt to allow editing is enabled, you will be able to edit files after accepting a warning that appears on each edit attempt. Otherwise, editing of files of non-.NET languages will be blocked when you are in the debug mode. |
.NET Languages
Item | Description | ||||
|---|---|---|---|---|---|
Save all files on debugger launch | If this checkbox is enabled, all files are saved automatically when you start debugging to make sure that the files are synchronized with the debugger. | ||||
Show breakpoint preview on mouse hover | If this checkbox is enabled, JetBrains Rider will show a preview icon when you hover over a line where it is possible to set a breakpoint:  | ||||
Enable external source debug | Enables automatic decompilation and debugging of external code. If this option is disabled, you can still navigate to external code and set breakpoints there. However, breakpoints in external code will be ignored by the debugger and you will not be able to step into external code. So your debugging experience will be limited by the source code in your solution. | ||||
Show floating debugger actions | If this option is enabled, you can hover over a target statement and use the icons that appear to run to cursor and skip to cursor:  | ||||
JIT (Excluding Mono) | |||||
Disable JIT optimization on module load | This option (which is on by default) suppresses optimization made by the just-in-time (JIT) compiler. This means that the non-optimized code will be executed slower, but it will match the source code. Normally, you need this option to be enabled unless you are debugging a problem that cannot be reproduced in the non-optimized code. If you clear this option, the debug information that JetBrains Rider displays could be limited. Note also that when you attach to a running process, the JIT optimization will be only disabled for modules that are loaded after you attach. | ||||
Use JIT even if pre-compiled assemblies are available | If a pre-compiled image (NGen, CrossGen, or any AOT) is loaded for an assembly, JIT will not run and disabling JIT optimization has no effect. This option lets the debugger ignore the pre-compiled image and makes JIT compile the assembly. It slows down the process startup, but allows inspecting optimized local variables in the assembly (if JIT optimization is disabled). | ||||
Value inspections | |||||
Allow property evaluations and other implicit function calls | Enables automatic evaluation of properties and implicit calls such as | ||||
Evaluation timeout | Defines the timeout, after which the evaluation call is aborted. | ||||
Refresh watched values on debugger pause | Use this checkbox to automatically refresh expressions that include functions calls in watches. When the checkbox is enabled, all watches will be refreshed automatically, but complex expressions with function calls could negatively affect debugger performance and can also lead to unexpected changes in the program state. When the checkbox is disabled, simple variables and expressions will be refreshed automatically anyway, and you will be able to refresh complex expressions with an explicit action when necessary. | ||||
Show hex value for integers | Use this checkbox to additionally display hex presentation next to the integer values in the Debug window and inline in the editor. | ||||
Show return values | |||||
Show fully qualified type names | |||||
Flatten objects hierarchy | |||||
Show non-public members in a separate group | |||||
Cluster big arrays | |||||
Add raw view for debugger browsable values | |||||
Show compiler-generated members | |||||
Show type variables | |||||
Truncate presentation of long strings | |||||
Exceptions | |||||
Process exceptions outside of my code (Excluding Mono) | Use this option to make the debugger stop on exceptions that meet all the following criteria:
If you do not need to stop in system external code, it is recommended to keep this checkbox disabled because it can affect debugger performance, especially if external code throws lots of exceptions. This might be even more noticeable on macOS and Linux, where the .NET debug engine is relatively slow. Fore more information, see Microsoft Documentation. | ||||
Pin to Top | |||||
'Pin to top' should change presentation of debugger objects | |||||
Just-in-Time debugger (Windows-only) | This set of options lets you configure the default just-in-time (JIT) debugger for your system. You can see the current JIT debuggers for 32 bit and 64 bit process and use the buttons to set JetBrains Rider as the default debugger or restore the one which was set default previously. When JetBrains Rider is set as the default JIT debugger and a process calls
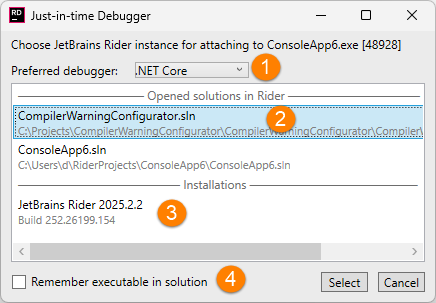 | ||||
Blazor WASM Debugging | |||||
Enable Blazor WASM Debugging |
| ||||
Debugger data flow analysis | |||||
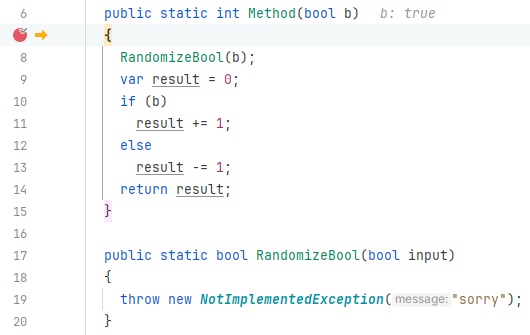
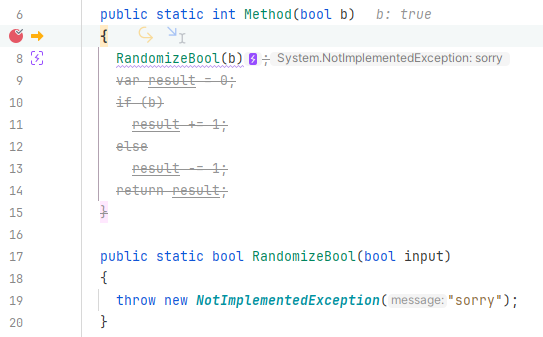
Enable debugger data flow analysis | Enables or disables Predictive debugger.
| ||||
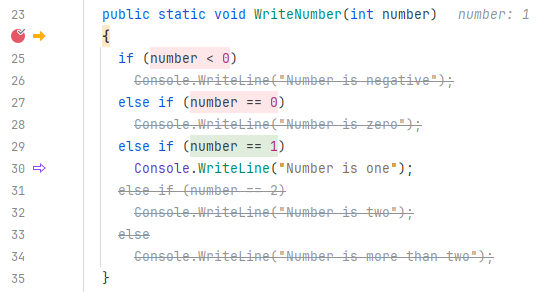
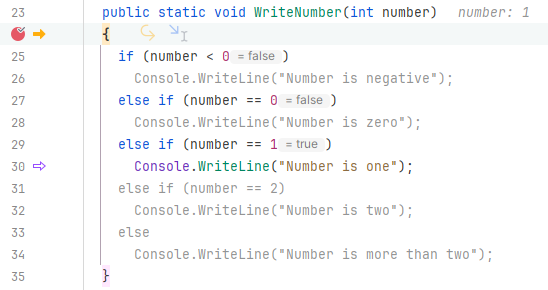
Enable colorized mode | When enabled, results of boolean expressions are highlighted in color; otherwise they are shown as inline hints.
| ||||
Evaluation timeout | After stepping into a function, predictive debugger is performed in a limited timeframe, which is 3000 milliseconds by default. In complex functions, this may not be enough to analyze all execution paths; on the other hand, stepping speed may be affected. If necessary, you can increase or decrease the default timeout | ||||
