Query console
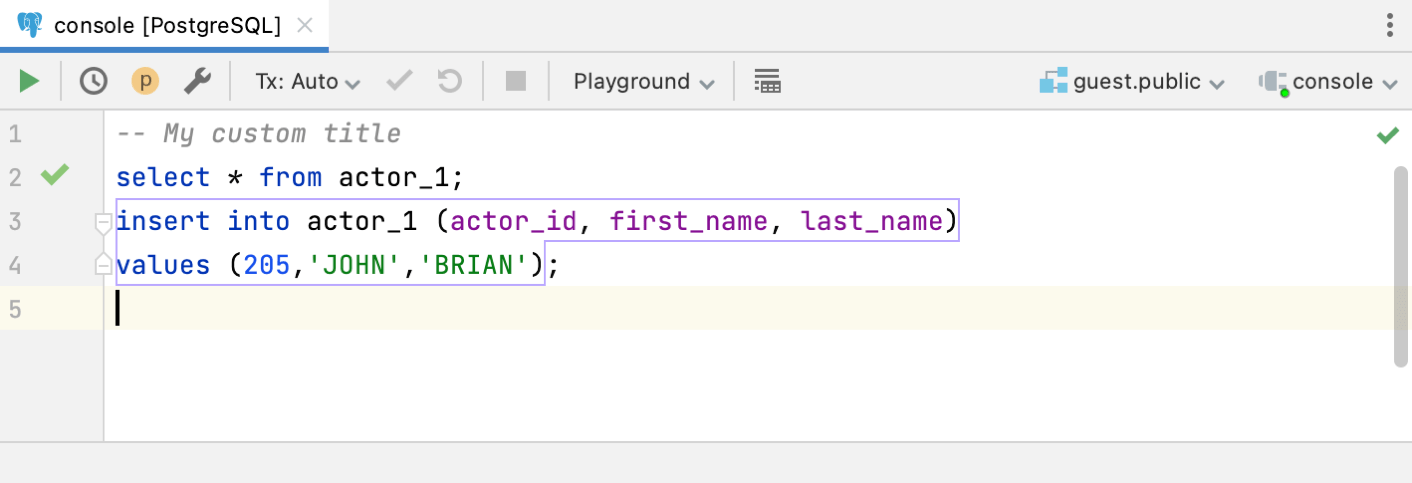
Query consoles are SQL files that are associated with a data source and connected to it via a connection session. In query console you can compose and execute your SQL statements.
For example, if you open a query console for PostgreSQL, a connection session to the PostgreSQL data source is automatically created. When you open an SQL file from your hard drive, you need to specify the connection session first.
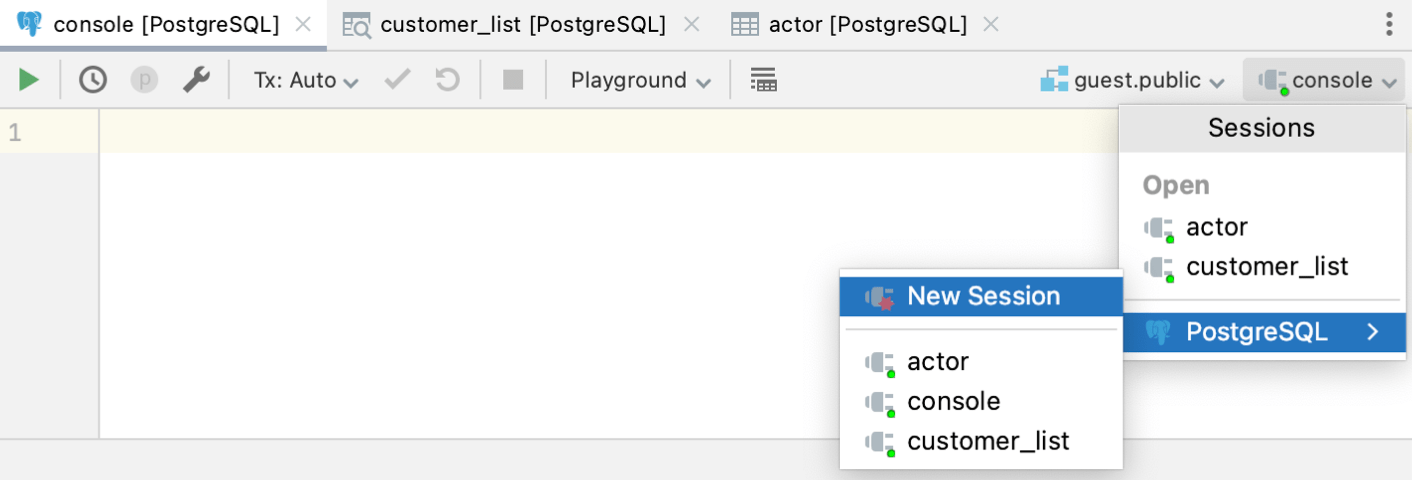
For each console, a data source connection session is created automatically. You can create new connection sessions and attach your console to existing ones in the console toolbar.
In the following example, the PostgreSQL console is associated with the guest.public schema of a data source and connected to it via the console connection session. You can change the console session to actor or create a new session and attach the console to it.
Read more about managing sessions in Managing connection sessions.

The code editor is where you compose your SQL statements using the resolve modes and coding assistance features, and execute them against the associated data source.
Find the code editor toolbar controls in Code editor controls. Read more about the editor in Editor basics.
In order to run SQL scripts, treat the usages of the database objects as links, and provide you with correct code completion, DataGrip must resolve the database objects in your code to a certain context. By default, IDE uses one of the following as a starting point to resolve the database objects to: <schema> selector, or the default database (if none of the above is set).
For more information about resolve modes, refer to Resolve modes.
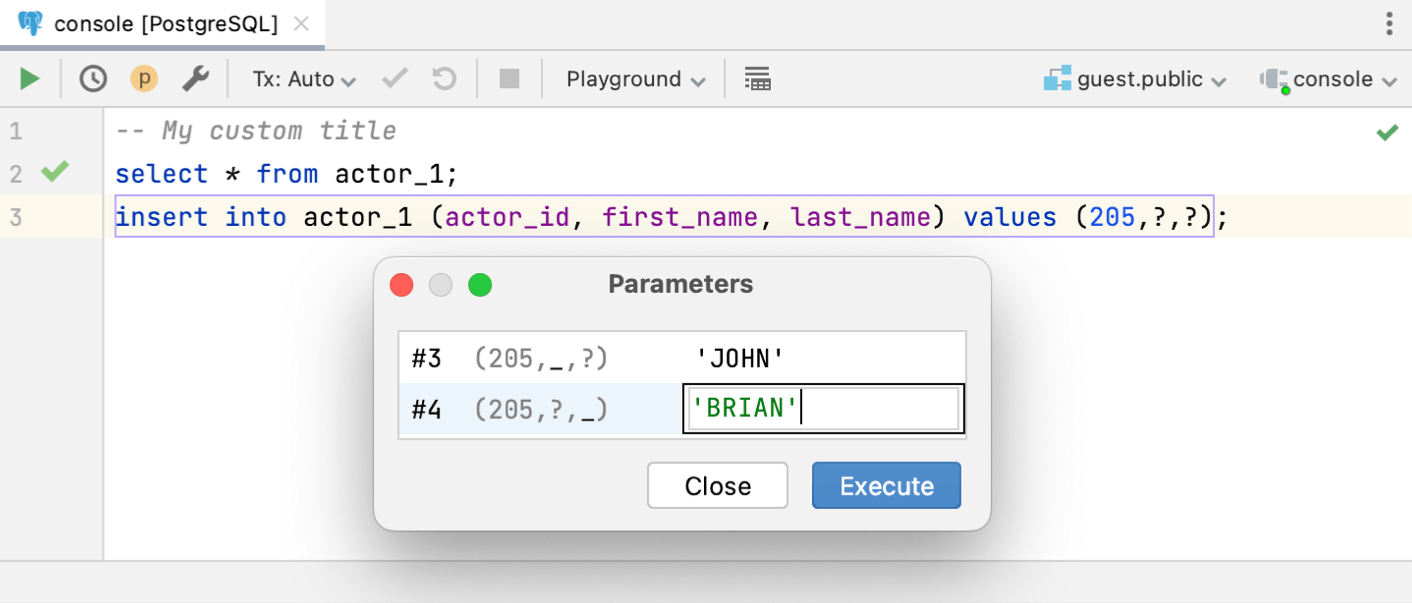
Before execution of a parametrized statement, you see the Parameters window where you can specify values for the parameters.

When you execute a statement, the Services tool window opens. The Services tool window displays available connection sessions, Output and Result tabs. For more information about the Services tool windows, see Services tool window.
If the executed statement retrieves data (for example,
SELECT), results are displayed in the Result tab that has a title of a qualified table name. For more information about creating custom titles for result tabs, see Use custom titles for tabs with results.If the executed statement does not retrieve data, results are displayed in the Output tab.
Active Result tabActive Output tab
Services tool window.

Services tool window.
Output and Result tabs. Output tab is active.
Right toolbar of the Output tab.
Use the code editor to compose and execute your SQL statements as well as to perform other associated tasks.
Read more about the editor in Editor basics.

Item | Tooltip and shortcut | Description |
|---|---|---|
Execute CtrlEnter | Execute selected SQL statement or statements. If nothing is selected, the current statement is executed. | |
Browse Query History CtrlAlt0E | Open a dialog that shows all the statements that you have run for the corresponding data source. See also, Using the History dialog. | |
View Parameters | Open or close the Parameters dialog. | |
Open Query Execution Settings… | Open the Database | Query Execution section of the Settings dialog to view or edit the query execution settings. For more information on these settings, refer to Query Execution. | |
| Transaction Mode and Transaction Isolation | Select the isolation level for database transactions and the way the transactions are committed.
For more information about database transaction modes and isolation, refer to Submit changes to a database. |
Commit CtrlAltShiftEnter | Commit the current transaction. See also, transaction modes and isolation. | |
Roll Back | Roll back changes. This button is available only for the manual transaction mode. See also, transaction modes and isolation. | |
Cancel Running Statements CtrlF2 | Terminate execution of the current statement or statements. | |
| File Resolve Mode | Select the resolve mode to manage the context that database objects in your code are resolved to.
For more information about the resolve modes, refer to Resolve modes. |
In-Editor Results | Toggle the display of query result within the code editor of query console.  For more information about the in-editor results, refer to In-Editor Results. | |
| Switch current schema | Select the default schema or database. For PostgreSQL, Amazon Redshift, and Greenplum use the <schema> list to form the schema search path.  For more information about schemas, refer to Schemas. |
| Switch attached session | Select the database connection session. For more information on the database connection sessions, refer to Managing connection sessions |
In the code editor context menu, use the following actions to increase your productivity:
Item | Shortcut | Description |
|---|---|---|
| In INSERT statements, opens the editor for working with the data in a table format.  | |
Change Dialect (<CurrentDialect>) | Change the SQL dialect. Select a dialect from the list. | |
Explain Plan |
| |
| CtrlEnter | Execute the current statement or the sequence of selected statements. |
| Execute the current statement and save results in a text file. Select the output format and specify the file location and name. | |
Run 'console [data_source]' | CtrlShiftF10 | Execute all the statements in the query console. |
Thanks for your feedback!

