Services tool window
View | Tool Windows | Services or Alt08
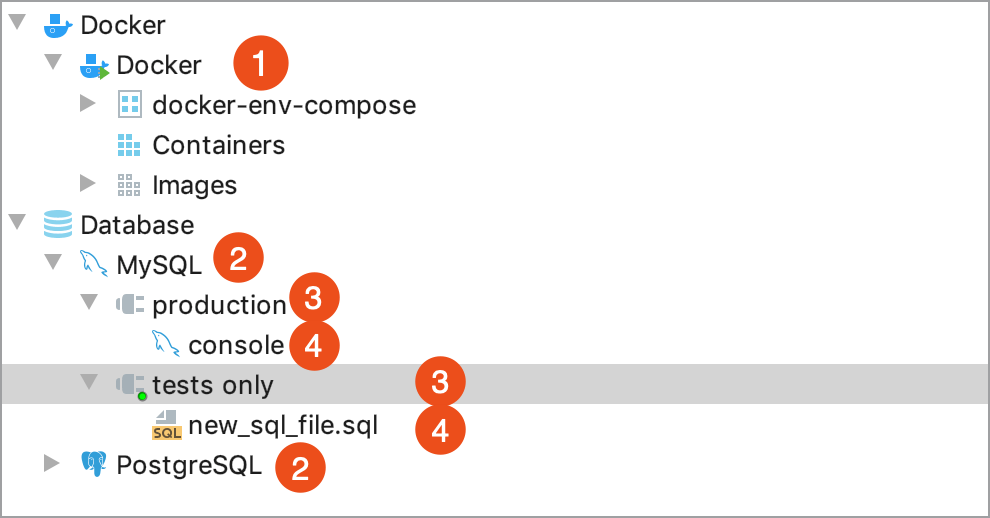
The Services tool window allows you to use database and Docker services. To use Docker, install the Docker plugin. For more information about Docker, see Docker. In the Services tool window, you can view and manage Docker containers and images (1), data sources (2), connection sessions (3), and files attached to these sessions (4). The small green light on the session icon indicates that you are connected to a data source.

For a quick overview of the Services tool window, see the following video.
The main toolbar contains the following buttons and menus that are common for all service types:
Expand All NumPad +
Expand all items in the list.
Collapse All NumPad -
Collapse all items in the list.
Group By
Choose how you want to organize the list of services.
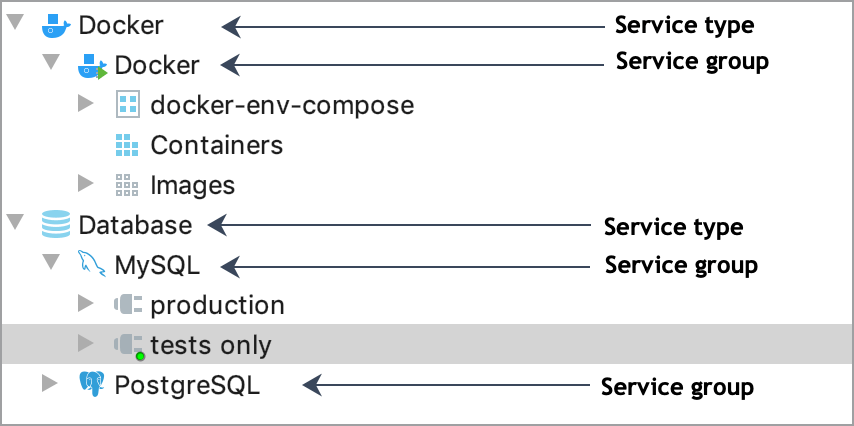
Service Type: adds a root node that describes a service type (for example, Docker or Database)
Service Groups: adds a parent node that describes a particular group (for example, a data source name)

Filter
Choose how you want to filter the list of services.
Open in New Tab
Move the selected items to a separate tab.
Add Service AltInsert
Choose a service type to add.
Run/debug configurations are not listed in the Services tool window by default. You need to explicitly specify the types of configurations you want to be available and create the corresponding configurations.
Select View | Tool Windows | Services from the main menu or press Alt08.
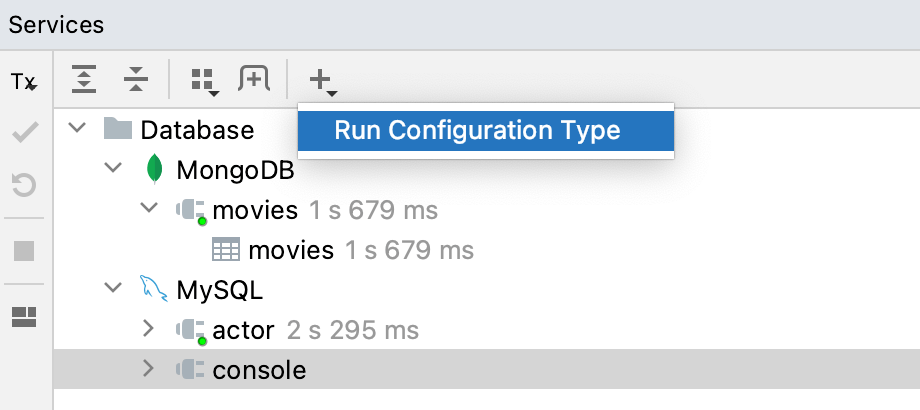
In the Services tool window, click Add service, then select Run Configuration Type.

Select a run/debug configuration type from the list to add all configurations of this type to the window.
Note that the tool window will only display the configuration types for which you have created one or more configurations.
Buttons on the toolbar depend on the selected type of the run/debug configuration.
Icon | Action | Description |
|---|---|---|
Run CtrlShiftF10 | Run the selected configuration. | |
Debug | Debug the selected configuration. | |
Stop CtrlF2 | Stop the selected configuration. |
In the database service, you can manage your sessions and connections. Connection is a physical communication channel and session is a state of information exchange. For example, if you surf a social network, your connection log might have thousands of connection entries between a client and a server while a session log might show you only a single log entry with the number of bytes transferred.
For more information about managing database sessions, see Manage connection sessions.
Item | Tooltip and shortcut | Description |
|---|---|---|
Tx | Transaction Mode and Transaction Isolation | Select the isolation level for database transactions and the way the transactions are committed.
For more information about database transaction modes and isolation, refer to Submit changes to a database. |
Commit CtrlAltShiftEnter | Commit the current transaction. See also, transaction modes and isolation. | |
Roll Back | Roll back changes. This button is available only for the manual transaction mode. See also, transaction modes and isolation. | |
Cancel Running Statements CtrlF2 | Terminate the execution of the current statement. | |
Restore Default Layout CtrlF2 | Restore default positions of visual elements in the Service view. | |
Jump to Console CtrlShiftF10 | Open the Consoles popup. In the Consoles popup, you can select a query console that you want to open in the editor. | |
Disconnect CtrlF2 | (For data sources) Close a connection to the selected data source. | |
Cancel Running Statements CtrlF2 | (For sessions and attached files) Close a connection to the selected data source. |
Icon | Action | Description |
|---|---|---|
Jump to Console CtrlShiftF10 | Open the Consoles popup. In the Consoles popup, you can select a query console that you want to open in the editor. | |
Deactivate CtrlF2 | Close a connection to the selected data source. | |
Close All Sessions | Close all opened sessions to a data source. | |
Show in New Tab | Move the selected items to a separate tab. | |
Open Each in New Tab | Split the selected items into separate tabs. | |
Open Each Tab in New Tab | Create separate tabs for each type of service. | |
Delete Delete | Close all opened sessions to a data source. Identical to Close All Sessions. |
Icon | Action | Description |
|---|---|---|
Tx | Tx Mode and Tx Isolation | Choose the isolation level for database transactions and the way transactions are committed.
|
Commit CtrlAltShiftEnter | Commit the current transaction. | |
Rollback | Roll back the last transaction. | |
Cancel Running Statements CtrlF2 | Stop execution of running statements. | |
Restore Default Layout CtrlF2 | Restore visual elements of are arranged. | |
Rename Session | Display the Rename dialog where you can specify a name for a session. | |
Close Session | Close the selected session. | |
Show in New Tab | Move the selected items to a separate tab. | |
Open Each in New Tab | Split the selected items into separate tabs. | |
Open Each Tab in New Tab | Create separate tabs for each type of service. | |
Delete Delete | Close all opened sessions to a data source. Identical to Close All Sessions. |
Icon | Action | Description |
|---|---|---|
Tx | Tx Mode and Tx Isolation | Choose the isolation level for database transactions and the way transactions are committed.
|
Commit CtrlAltShiftEnter | Commit the current transaction. | |
Rollback | Roll back the last transaction. | |
Cancel Running Statements CtrlF2 | Stop execution of running statements. | |
Restore Default Layout CtrlF2 | Restore visual elements of are arranged. | |
Switch Session | Display the Sessions popup where you can select or create a new session and connect to it. | |
Detach Session | Detach the selected file from the current session. To attach the file to a session, open the file in the editor, and select the session in the sessions list.  | |
Show in New Tab | Move the selected items to a separate tab. | |
Open Each in New Tab | Split the selected items into separate tabs. | |
Open Each Tab in New Tab | Create separate tabs for each type of service. | |
Delete Delete | Close all opened sessions to a data source. Identical to Close All Sessions. | |
Jump to Source F4 | Open the file in the editor. |
This type of service is available if you have configured connection settings for at least one Docker instance. For more information, see Connect to the Docker daemon.
note
To use Docker functionality, install the Docker plugin.
Click
and select Docker Connection.
Configure the docker connection settings in the New Docker Connection dialog.
tip
If you have Docker contexts configured, you can select Docker Connections from Docker Contexts to add the corresponding connections.
These are the main actions for working with the selected Docker connection:
Icon | Action | Description |
|---|---|---|
Connect | Connect to the Docker daemon and list all available images and containers. | |
Disconnect | Disconnect from the Docker daemon. | |
Edit Configuration | Edit the Docker connection settings. | |
Deploy | Select an existing Docker run configuration or create a new one. For more information, see Docker containers | |
Delete Connections | Delete the connection to the selected Docker daemon. | |
Pull Image… | Pull an image from a Docker registry. For more information, see Pull a public image from Docker Hub. | |
Clean Up | Remove all stopped containers, unused volumes and networks, dangling images, and all build caches. |
This node lists all containers managed by the corresponding Docker daemon.
Icon | Action | Description |
|---|---|---|
Clean Up | Remove all stopped containers. |
When you select a container, the following actions are available:
Icon | Action | Description |
|---|---|---|
Start Container | Run the selected container. | |
Stop Container | Stop the selected container. | |
Delete Container | Delete the selected container. |
The Dashboard tab provides important information about the selected container:
Name and hash ID of the container. You can click the image name to highlight the image that was used to run the selected container.
Names and values of environment variables defined in the container.
Ports mappings between the container and the host.
Volume bindings between the container and the host.
Click Add... to add a new variable, port binding, or volume binding, and recreate the container.
Click to open a menu with some additional actions:
Action | Description |
|---|---|
Show Log | Open a tab with the log messages from the container's standard output streams: For more information, see the docker logs command reference. |
Show Files | Open a tab with the file browser for the running container. Select any file and click
|
Inspect | Run |
Copy Image ID | Copy the hash ID of the image used to run this container. |
Copy Container ID | Copy the hash ID of the container. |
This node lists all images managed by the corresponding Docker daemon.
Icon | Action | Description |
|---|---|---|
Pull Image… | Pull an image from a Docker registry. For more information, see Pull a public image from Docker Hub. | |
Clean Up | Remove all unused images. |
When you select an image, the following actions are available:
Icon | Action | Description |
|---|---|---|
Create Container | Create a Docker container from the selected image. | |
Delete Image | Remove the selected image. | |
Copy Docker Image | Copy an image from one Docker daemon to another. For more information, see Copy image to another Docker daemon. | |
Push Image… | Push an image to a Docker registry. For more information, see Push an image to a Docker registry. |
The Dashboard tab provides important information about the selected image:
Name, hash ID, date of latest changes, and size of the image.
List of tags that point to the image.
List of existing containers created from this image.
It also includes some useful actions for the selected image:
Action | Description |
|---|---|
| Create a Docker container from the selected image. |
| Push an image to a Docker registry. For more information, see Push an image to a Docker registry. |
| Open a tab that shows the layers (intermediate internal untagged images) from which the selected image consists. |
Click to open a menu with some additional actions:
Action | Description |
|---|---|
Copy Image ID | Copy the hash ID of the selected image. |
Inspect | Run |
Show Labels | Open a tab with the image's labels. |
This node lists all networks managed by the corresponding Docker daemon.
Icon | Action | Description |
|---|---|---|
Create Network | Create a Docker network for your containers to operate. | |
Clean Up | Remove all unused networks. |
The Dashboard tab provides important information about the selected network:
Name and hash ID of the network.
List of containers connected to this network.
List of labels assigned to this network.
Click Inspect to run docker inspect on the selected network and output it to a separate tab.
This node lists all volumes managed by the corresponding Docker daemon.
Icon | Action | Description |
|---|---|---|
Create Volume | Create a Docker volume for your containers to use. | |
Clean Up | Remove all unused volumes. |
When you select a volume, the following actions are available:
Icon | Action | Description |
|---|---|---|
Delete Volume | Remove the selected volume. |
The Dashboard tab provides important information about the selected volume:
Name or hash ID of the volume.
List of containers that use this volume.
It also includes some useful actions for the selected volume:
Action | Description |
|---|---|
| Run |
| Remove the selected volume. |
Click to open a menu with some additional actions:
Action | Description |
|---|---|
Show Labels | Open a tab with the volume's labels. |
Icon | Action | Description |
|---|---|---|
Deploy | Deploy your selected Docker Compose services using the associated run/debug configuration. For more information, see Docker Compose | |
Stop | Stop all containers in the selected Docker Compose services. | |
Down | Stop and remove all containers in the selected Docker Compose services, including all related networks, volumes, and images. | |
Edit Configuration | Edit the selected Docker Compose run configuration. | |
Filter | Choose whether you want to show or hide containers that are not running and images with no tags. |
Icon | Action | Description |
|---|---|---|
Start | Start all containers for the selected service. | |
Stop | Stop all containers for the selected service. | |
Scale | Change the number of containers for the selected service. | |
Delete Container | Delete the selected container. | |
Filter | Choose whether you want to show or hide containers that are not running and images with no tags. |
This type of service is available if:
The Kubernetes plugin is installed and enabled. For more information about the Kubernetes integration in DataGrip, see Kubernetes.
DataGrip detects a Kubernetes cluster configuration file. By default, this is a file named
configin the $HOME/.kube directory. You can specify other kubeconfig files by setting theKUBECONFIGenvironment variable. For more information about kubeconfig files, see Organizing Cluster Access Using kubeconfig Files.
The Kubernetes node in the Services tool window lists the resources of the Kubernetes cluster in the selected context.
For more information, see Configure Access to Multiple Clusters.
Icon | Action | Description |
|---|---|---|
Refresh | Refresh information from the Kubernetes cluster. | |
Namespace | Select a namespace to filter the listed resources of the cluster. | |
Context | Select the Kubernetes context displayed in the Services tool window. This does not change the context of the running Kubernetes cluster. | |
Refresh Configuration | Read the Kubernetes cluster configuration from the | |
Show Settings | Open the Kubernetes cluster settings where you can change the path to the You can select the Set this path only for the current project checkbox on the settings page to use different configuration files in different projects. | |
View YAML | In the opened file, the following actions are available:
| |
Describe Resource | Display detailed information about the selected resource, similarly to the | |
Delete Resource | Remove the selected resource from the cluster. | |
Follow Log | Output the log of a container in the selected pod. | |
Download Log | Save the log of a container in the selected pod to a scratch file and open it in the editor. Instead of using a scratch file, you can set the path for saving logs or choose the location every time. To configure the download location for pod logs, click | |
Open Console | Attach to the console of the process running inside a container of the selected pod. | |
Run Shell | Run an interactive shell for the container in the selected pod. By default, DataGrip runs | |
Forward Ports | Forward one or more local ports to remote ports in a pod. For example:
Fore more examples on port forwarding, refer to the Kubernetes documentation. |
- Use tabs
The Services tool window can include a lot of services, which you can group according to their type or create separate tabs for your own custom grouping. For example, you can create a tab that will include the following: the run configuration for the application that you are developing, the Docker container that runs the database used as a backend for your application, and a console for accessing the database.
- Hide the services tree
Click
in the right part of the Services tool window toolbar and then click Show Services Tree to remove the checkbox. You can also press CtrlShift0T to toggle the services tree.
If you hide the services tree, it is replaced by a services navigation bar. Press AltHome to focus the services navigation bar.
- Hide, remove, and delete services
Right-click any service and select Delete Delete to completely remove the corresponding run configuration, cloud provider, Docker connection, and so on.
If you don't want to show run/debug configurations of a certain type in the Services tool window, right-click the corresponding configuration and select Remove Configuration Type from Services. This will not remove the actual configuration.
To hide a specific run configuration from the Services tool window, right-click the corresponding configuration and select Hide Configuration. To see all hidden run configurations, click
and select Restore Hidden Configurations.
Thanks for your feedback!